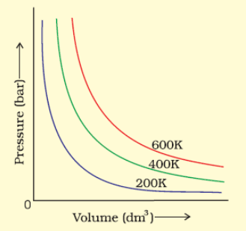
The variation of pressure with volume of the gas at different temperatures can be graphically represented as shown in the figure. On the basis of this graph, at constant pressure, how will the volume of a gas change if the temperature is increased from to ?
Important Questions on States of Matter
Pressure versus volume graph for a real gas and an ideal gas are shown in the figure. Answer the following question on the basis of this graph.
Interpret the behaviour of real gas with respect to ideal gas at low pressure.

Pressure versus volume graph for a real gas and an ideal gas are shown in the figure. Answer the following question on the basis of this graph. Interpret the behaviour of real gas with respect to ideal gas at high pressure.
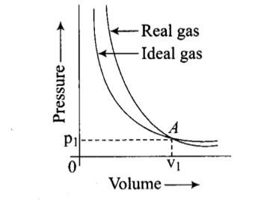
Pressure versus volume graph for a real gas and an ideal gas are shown in the figure. Answer the following question on the basis of this graph. Mark the pressure and volume by drawing a line at the point where real gas behaves as an ideal gas.

Match the graphs between the following variables with their names:
| Graphs | Names |
| (i) Pressure vs temperature graph at constant molar volume. | (a) Isotherms |
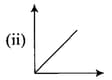
| (ii) Pressure vs volume graph at constant temperature. | (b) Constant temperature curve |
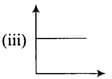
| (iii) Volume vs temperature graph at constant pressure. | (c) Isochores |
| (d) Isobars |
Match the following gas laws with the equation representing them
| (i) Boyle’s law |
(a) at constant and |
| (ii) Charle’s law |
(b) at constant . |
| (iii) Dalton’s law |
(c) Constant |
| (iv) Avogadro law |
(d) at constant and |
|
(e) at constant and |
Match the following graphs of ideal gas with their co-ordinates :
| Graphical representation | x and y co-ordinates |
 |
(a) |
 |
(b) |
 |
(c) |
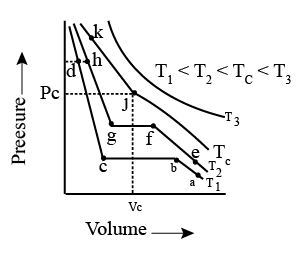
Isotherms of carbon dioxide at various temperatures are represented in the figure. Answer the following question based on this figure. In which state will exist between the points a and b at temperature ?
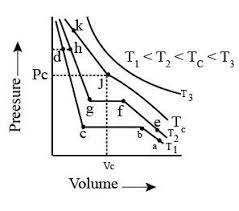
Isotherms of carbon dioxide at various temperatures are represented in the figure. Answer the following question based on this figure. At what point will start liquefying when temperature is ?