
HARD
Earn 100
The x-t graph shown in figure represents
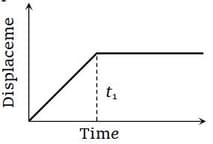
50% studentsanswered this correctly
Important Questions on Measurements and Motion
HARD
MEDIUM
EASY
EASY
EASY
HARD
MEDIUM
MEDIUM
EASY
EASY
MEDIUM
EASY
MEDIUM
EASY
What is the slope of the line passing through the points and ? Write the equation of the line.
MEDIUM
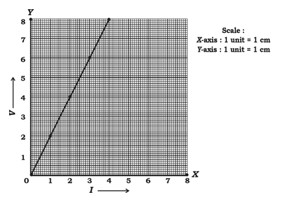
A student, while conducting an experiment on Ohm’s law, plotted the graph according to the given data. Find the slope of the line obtained.
| -axis | ||||
| -axis |
MEDIUM
EASY
MEDIUM


