
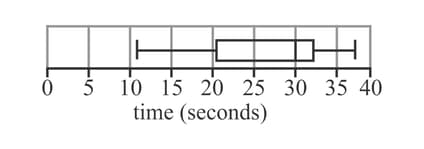
This box-and-whisker diagram shows the times taken by people to complete a simple word puzzle. Construct a cumulative frequency curve for the data.
Important Questions on Getting your Ducks in a Row (Working with Grouped Data)
The cumulative frequency curve here shows the speeds (in kilometres per hour) of some cars on motorway .

Find an estimate for the median speed.(Answer without units)
The cumulative frequency curve here shows the speeds (in kilometres per hour) of some cars on motorway .
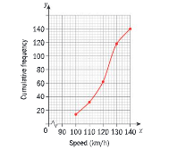
The speed limit on the motorway is .
Find an estimate for the percentage of cars exceeding the speed limit.
The cumulative frequency curve here shows the speeds (in kilometres per hour) of some cars on motorway .
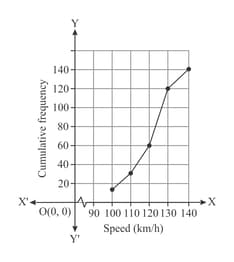
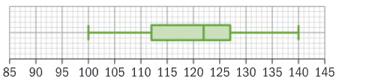
Construct a box-and-whisker diagram for the speed data for motorway .
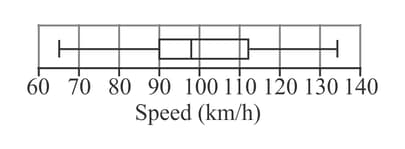
The box-and-whisker diagram below shows the speeds of some cars on motorway
 .
.
The box-and-whisker diagram below shows the speeds of some cars on motorway .
The box-and-whisker diagram below shows the speeds of some cars on motorway .
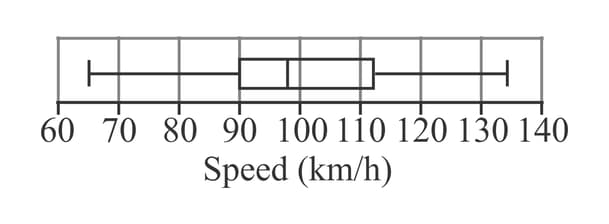 .
.
Compare the speeds of the cars on motorway and motorway .
State whether this class interval represent continuous or discrete data, and give reasons for your answer.
State whether this class interval represent continuous or discrete data, and give reasons for your answer.
State whether this class interval represent continuous or discrete data, and give reasons for your answer.
State whether this class interval represent continuous or discrete data, and give reasons for your answer.


