MEDIUM
MYP:4-5
IMPORTANT
Earn 100
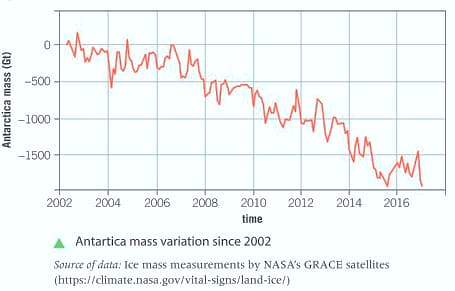
This graph shows the Antarctica mass variation since .

Interpret the presented data and describe the trend over the past years.


Important Questions on Evidence
HARD
MYP:4-5
IMPORTANT
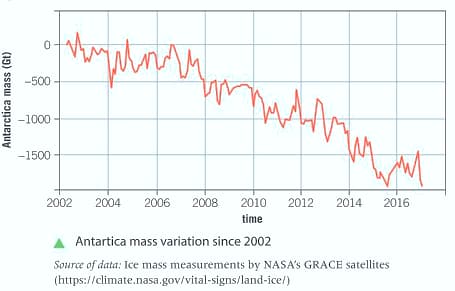
This graph shows the Antarctica mass variation since .

Apart from the overall trend in the data, hypothesise why there are small upward and downward variations in the total land ice mass within a calendar year.
HARD
MYP:4-5
IMPORTANT
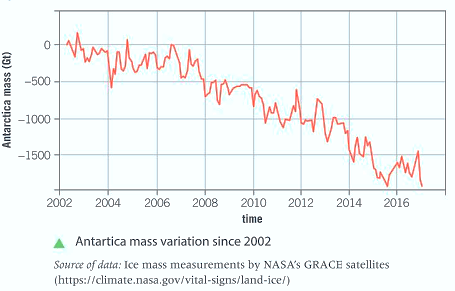
This graph shows the Antarctica mass variation since .

Estimate the change in mass for the period .
HARD
MYP:4-5
IMPORTANT
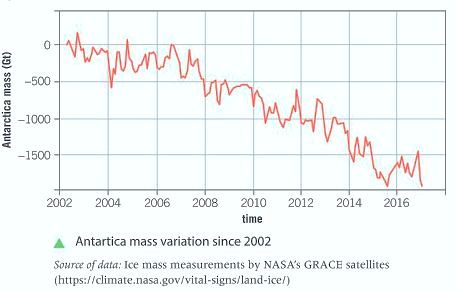
This graph shows the Antarctica mass variation since .

Analyse the data and comment whether the rate of loss of mass is increasing or decreasing, in the decade following . Support your argument with mathematical evidence.
HARD
MYP:4-5
IMPORTANT
MEDIUM
MYP:4-5
IMPORTANT
MEDIUM
MYP:4-5
IMPORTANT
HARD
MYP:4-5
IMPORTANT
HARD
MYP:4-5
IMPORTANT
