
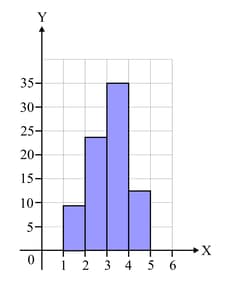
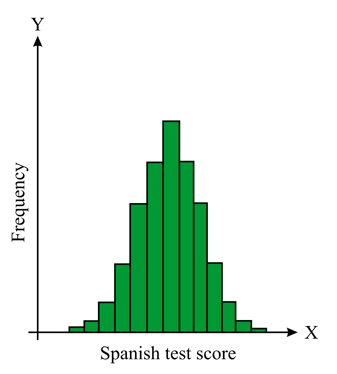
This histogram has no title or axis labels.

Determine whether it represents discrete or continuous data.
Important Questions on City Skylines (Histograms)
This histogram has no title or axis labels.

Suggest what the data could be.
This histogram has no title or axis labels.
Suggest what the data could be.
The histogram shows the number of hours that Macey spent doing homework each day in June.
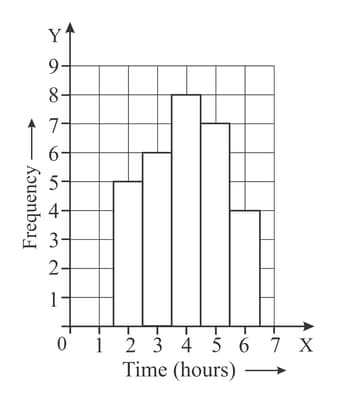
Use the information in the frequency histogram to construct a grouped frequency table.
The histogram shows the number of hours that Macey spent doing homework each day in June.

Use your frequency table to calculate an estimate for the mean time that Macey spent doing homework.
Determine whether the histogram is symmetrical and if it is unimodal, bimodal or multimodal and if it contains outliers.
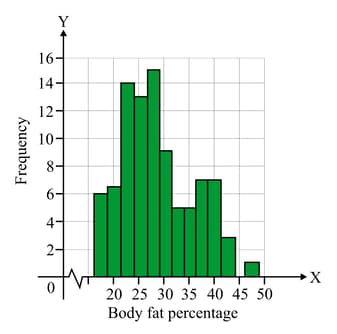
Determine whether the histogram is symmetrical and if it is unimodal, bimodal or multimodal and if it contains outliers.
Determine whether the histogram is symmetrical and if it is unimodal, bimodal or multimodal and if it contains outliers.
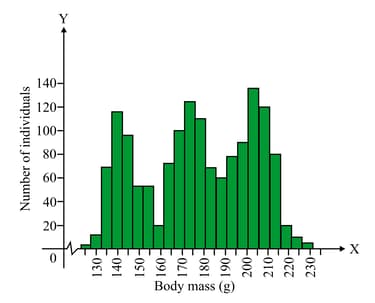
The histogram shows the lengths of black rats.
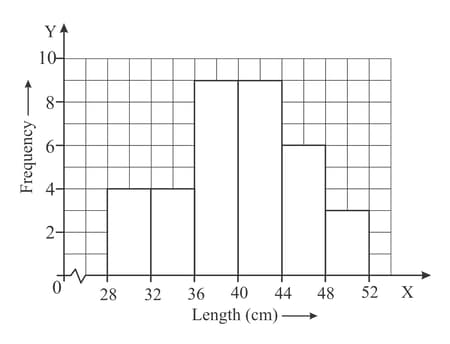
Write down the modal class.


