
This question is based on the following graph of Sex Ratio -.

Which of the following statements is incorrect?
I. The sex ratio has been generally favourable to women.
II. The sex ratio has been generally adverse to women.
III. The sex ratio has deteriorated over the decades.
IV. Males have outnumbered females.
V. The number of women per thousand men is generally lesser.
I. The sex ratio has been generally favourable to women.
II. The sex ratio has been generally adverse to women.
III. The sex ratio has deteriorated over the decades.
IV. Males have outnumbered females.
V. The number of women per thousand men is generally lesser.
Important Questions on Logical Interpretation of Data
This question is based on the following graph of Sex Ratio .
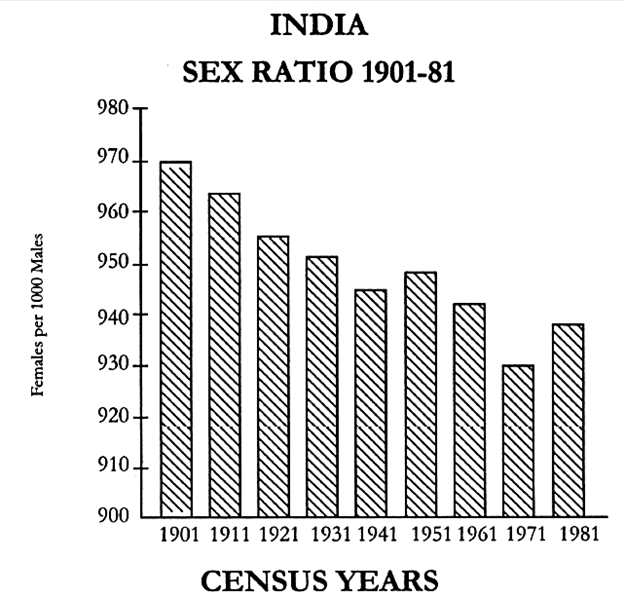
There is a gradual decline of sex-ratio from to except in the year.
DIRECTION: This question is based on the following graph of Sex Ratio
.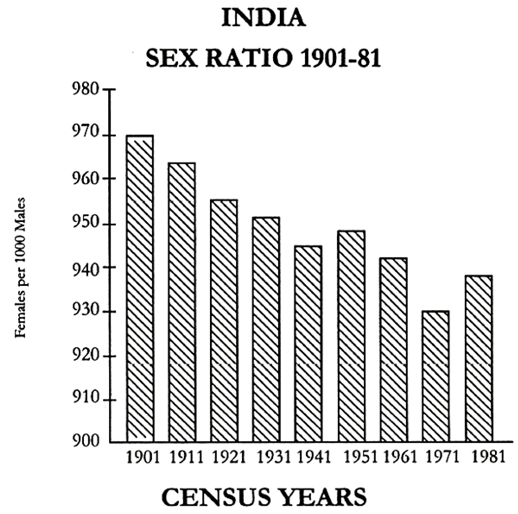
The highest deterioration rate in the sex ratio is found during the decade.
DIRECTION: This question is based on the following graph of Sex Ratio .

The sex ratio has improved in by:
Directions: The question given below is based on the graph of trends in sex ratio 1901-81 in India and 12 selected states (see above table). Study the trend carefully and answer the question given below.
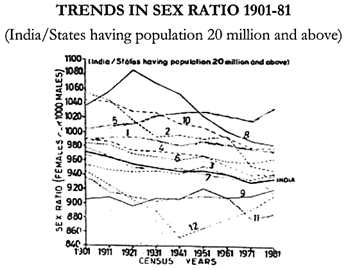
Which state records the highest sex ratio in which year?
DIRECTIONS : Questions are based on the graph of trends in sex ratio 1901-81 in India and 12 selected states (see above table). Study the trend carefully and answer the questions given below
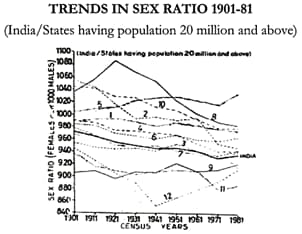
Which state records the lowest sex ratio in the year below all-India average?
DIRECTIONS : Questions are based on the graph of trends in sex ratio 1901-81 in India and 12 selected states (see above table). Study the trend carefully and answer the questions given below
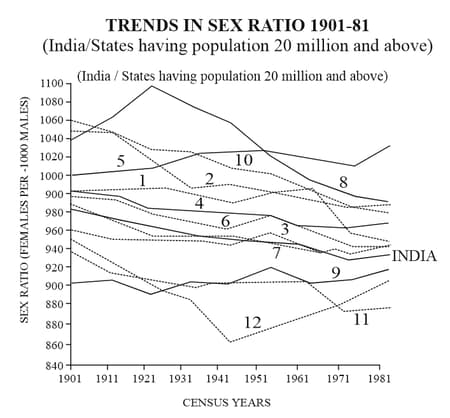
Indicate the group of states where the sex ratio is always below the all-India ratio during 1901-81.
(A) Andhra Pradesh, Madhya Pradesh, Karnataka
(B) Bihar, West Bengal, Odisha
(C) Rajasthan, Uttar Pradesh, West Bengal
(D) Goa, Daman and Diu
(E) Gujarat, Rajasthan, Maharashtra
DIRECTIONS : Questions are based on the graph of trends in sex ratio 1901-81 in India and 12 selected states (see above table). Study the trend carefully and answer the questions given below
Andhra Pradesh, Bihar, Karnataka, Kerala, Madhya Pradesh, Odisha and Tamil Nadu form a group in the trends of sex ratio by showing:
(A) higher sex ratio in four decades and lower in four decades than the all India average.
(B) lower sex ratio in first four decades and higher in the last four decades than the all-India average.
(C) sex ratio below all-India ratio during 1901 – 81.
(D) sex ratio above all-India ratio during 1901 – 81.
(E) None of the above is applicable
Questions are based on the graph of trends in sex ratio 1901-81 in India and 12 selected states (see above table). Study the trend carefully and answer the questions given below
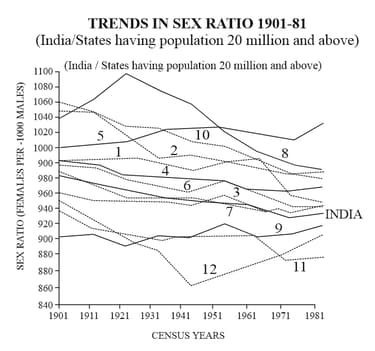
The state with sex ratio below all-India ratio except in the census years mentioned in brackets is:
(A) Maharashtra (1911, 1941, 1981)
(B) Madhya Pradesh (1921, 1941, 1961)
(C) Rajasthan (1951, 1961, 1981)
(D) Uttar Pradesh (1951, 1961, 1981)
(E) Gujarat (1951, 1971, 1981)


