
HARD
Earn 100
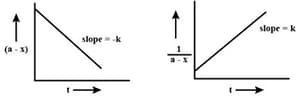
Two plots are shown below between concentration and time t. Which of the given orders are shown by the graph respectively?
50% studentsanswered this correctly
Important Questions on Chemical Kinetics
MEDIUM
MEDIUM
HARD
MEDIUM
The given plots represent the variation of the concentration of a reactant with time for two different reactions . The respective orders of the reaction are
(i) 
(ii) 
EASY
MEDIUM
EASY
MEDIUM
EASY
EASY
MEDIUM
HARD
MEDIUM
MEDIUM
EASY
EASY
MEDIUM
EASY
is zero
EASY
EASY


