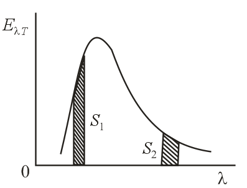
Two separate segments of equal area are isolated in the energy distribution of blackbody radiation. Are the emissive powers over the respective wavelength intervals the same? What about the number of emitted photons in each segment?
Important Questions on Optics
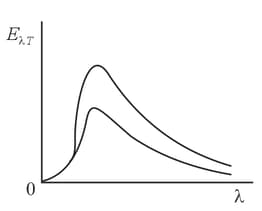
A student has sketched the curves representing the energy distribution in the emission spectrum of blackbody radiation for two temperatures as shown in the figure. What mistake did the student make?
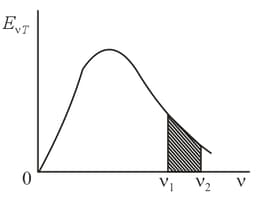
Determine the volume density of the energy of blackbody radiation over the frequency range from to . The radiation function is laid off on the vertical axis.
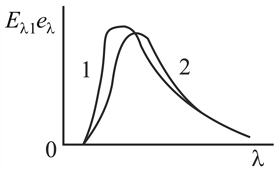
The ligure shows two curves: one corresponding to the energy distribution of blackbody radiation at a certain temperature obtained from theoretical assumptions (curve ), and the other corresponding to the energy disIribution of the radiation emitted by a certain object that has been heated to the same temperature (curve ). Why can we be sure that the experimental curve does not give a true picture?
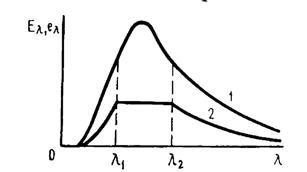
Curve in the figure depicts the energy distribution in the emission spectrum of a black body. Curve represents, in schematic form, the energy distribution in the emission spectrum of a certain object that has been heated to the same temperature as the black body. Curve consists of three segments: on the segments ranging from to and from to all ordinates of curve are one-half the respective ordinates of curve , while on the segment from to the value of remains constant. Sketch the distribution of the absorption coefficient (emissivity) over the wavelengths for the object in question.
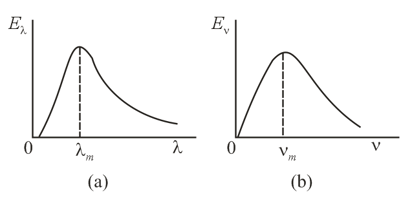
The radiation emitted by a black body can be represented either by the energy distribution over the wavelengths (Figure ) or by the energy distribution over the frequencies (Figure ). In the first case, the wavelength at which the black body emits a maximum amount of radiation is , while in the second the frequency at which the black body emits maximum amount of radiation is . Is it true that at a fixed temperature the quantities and are related through the formula
According to the electromagnetic theory of light, the light incident on a surface always exerts a pressure on that surface equal to
where is the intensity of the light, that is, the light energy arriving every second at a unit area of the surface, and is the reflection coefficient. Can the origin of this pressure be explained in the same manner as is done in the kinetic theory of gases, where the pressure of a gas on the wall of a vessel is interpreted as transfer of momentum from each particle to the wall?
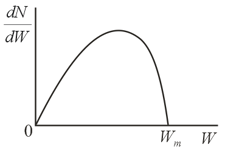
The energy distribution function for photoelectrons has the form shown in the figure. What determines the maximal energy of the photoelectrons?