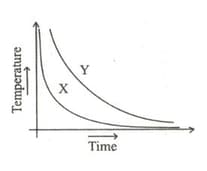
Two students X and Y have to do their experiment on plotting the temperature-time graph for a hot body as it cools to room temperature. They do their experiments in the same lab, using completely identical apparatus, take equal amounts of tap water heated up to the same temperature, start their observations simultaneously and note the temperature values at identically spaced intervals of time. Their temperature-time graphs, plotted on a given graph paper, with the same given choices of scales along the axis, are however, as shown: The following could be the reason for this difference:
(A) Use of an overhead fan by student X.
(B) Use of an overhead fan by student Y.
(C) Less frequent stirring of water by student X.
(D) Less frequent stirring of water by student Y.
The most likely reason is:

(B) Use of an overhead fan by student Y.
(C) Less frequent stirring of water by student X.
(D) Less frequent stirring of water by student Y.
The most likely reason is:


Important Questions on Sound
A student heats some amount of tap water in a calorimeter to a temperature of nearly above the room temperature. He then records the temperature of this water as it is cooling down at regular intervals of 2 minutes each. He tabulates his observations as follows:
| Time (in minutes) → | 0 | 2 | 4 | 6 | 8 | 10 |
| Temperature (in ºC) → | t1 | t2 | t3 | t4 | t5 | t6 |

