
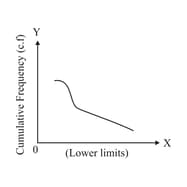
Using the cumulative frequency curve we can find out
Important Questions on Statistics
students enter for a game of shot-put competition. The distance thrown (in metres) is recorded below:
| Distance in meter | |||||||
| Number of students |
Use a graph paper to draw an ogive for the above distribution. Use a scale of on one axis and students on the other axis. Hence using your graph find the median.
Use graph paper for this question. The marks obtained by students in an English test are given below:
| Marks | ||||||||||
| Number of students |
Draw the ogive and hence, estimate the upper quartile marks.
Use graph paper for this question.
A survey regarding height (in ) of boys belonging to Class of a school was conducted. The following data was recorded:
|
Height in cm |
|||||||
|
No. of boys |
Taking height of along one axis and boys along the other axis draw an ogive of the above distribution. Use the graph to estimate the following:
If above is considered as the tall boys of the class. Find the number of boys in the class who are tall.
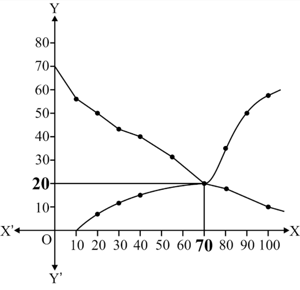
coordinate of intersecting point of two ogives, represents
Use graph paper for this question.
A survey regarding height (in ) of boys belonging to Class of a school was conducted. The following data was recorded:
|
Height in cm |
|||||||
|
No. of boys |
Taking height of along one axis and boys along the other axis draw an ogive of the above distribution. Use the graph to estimate the following:
The median
students enter for a game of the shot-put competition. The distance thrown (in meters) is recorded below,
| Distance in | |||||||
| Number of students |
Use graph paper to draw an ogive for the above distribution.
Use the scale of on one axis and students on the other axis.
Hence using your graph find the number of students who cover a distance which is above .
An insurance policy agent found the following data for distribution of ages of policy holders. Draw a ''less than type'' (below) of ogive for the given data:
| Age(in years) | Number of policy holders |
| Below | |
| Below | |
| Below | |
| Below | |
| Below | |
| Below | |
| Below |
Use graph paper for this question.
The marks obtained by 120 students in an English test are given below
| Marks | ||||||||||
| Number of students |
Draw the ogive and hence, estimate the number of students who did not pass the test if the pass percentage was 50.
State the type for curve A and curve

Find the median of the data from the above graph.
Use graph paper for this question.
The marks obtained by students in an English test are given below
| Marks | ||||||||||
| Number of students |
Draw the ogive and hence, estimate the median marks.
During the medical check-up of students of a class, their weights were recorded as follows. Draw a less than type of ogive for the given data:
| Weight in kg | Number of students |
| Less than | |
| Less than | |
| Less than | |
| Less than | |
| Less than | |
| Less than | |
| Less than | |
| Less than |
From the frequency distribution table given below, draw less than ogive:
| Marks obtained | |||||
| Frequency |
Use graph paper for the question.
A survey regarding height (in ) of boys belonging to class of a school was conducted. The following data was recorded:
| Height in | |||||||
| No. of boys |
Taking height of along one axis and boys along the other axis draw an ogive of the above distribution. Use the graph to estimate the lower quartile.
In " less than type ogive'', the axis represents
| Science | Arts | Commerce | Vocational | ||||
| Boys | Girls | Boys | Girls | Boys | Girls | Boys | Girls |
The ratio of the number of girls studying Arts to the number of girls studying in all other streams is:
Consider the following distribution:
| Marks obtained | Number of students |
| More than or equal to | |
| More than or equal to | |
| More than or equal to | |
| More than or equal to | |
| More than or equal to | |
| More than or equal to |
The frequency of the class is


