What can be done so that more non-farm production actlvities can be started in villages?
Important Questions on The Story of Village Palampur
The following Table . shows the land under cultivation in India in units of million hectares. Plot this on the graph provided. What does the graph show?
Table .: Cultivated area over the years
| Year | Cultivated Area (in Million Hectares) |
| (p) | |
| (P) | |
| (P) | |
| (P) | |
| (P) |
(P) - Provisional Data
Source: Pocket Book of Agriculture Statistics , Directorate of Economics and Statistics, Department of Agriculture, Cooperation and Farmers' Welfare.
What is the difference between multiple cropping and modern farming method?
The following table shows the production of wheat and pulses in India after the Green Revolution, in units of million tonnes. Was the Green Revolution equally successful for both the crops? Discuss.
Table : Production of pulses and wheat (in Million Tonnes)
| Years | Production of Pulses | Production of Wheat |
Source: Department of Agriculture, Cooperation and Farmers Welfare, as of February .
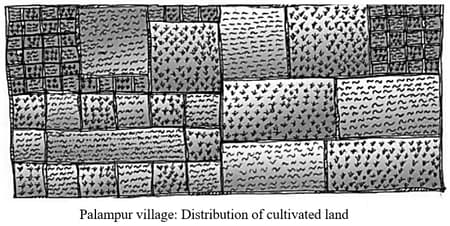
In the Picture , can you shade the land cultivated by the small farmers?
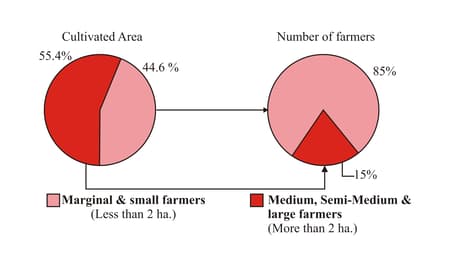
The distribution of farmers in India and the amount of land they cultivate is given in the following Graph