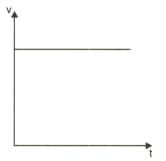
What do the graphs shown below indicate?
Important Questions on Motion
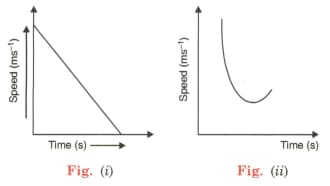
Two graphs for motion of objects moving along a straight line are shown. State how the speed is changing with time in both the cases.
The graph given below is a distance time graph of an object.
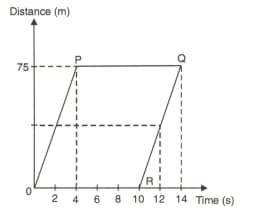
Find the speed of the object during the first of its journey.
The graph given below is a distance time graph of an object.

How long was it stationary?
The graph given below is a distance time graph of an object.

Does it represent a real situation? Justify your answer.
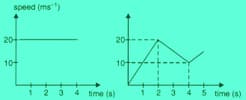
Four speed-time graphs are shown below.
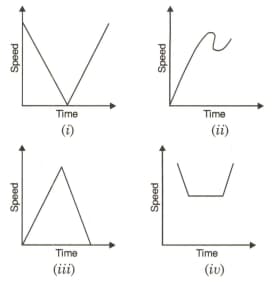
Which graph represents the following case?
A ball thrown vertically upward and returning to the hand of the owner.
Four speed-time graphs are shown below.

Which graph represents the following case?
A body decelerating to constant speed and accelerating after a while.
What would you conclude about the motion of a body depicted by the velocity time graph given below?