What is diathermic boundary?
Important Questions on Thermodynamics
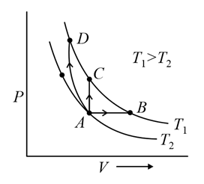
Three different processes that can occur in an ideal monoatomic gas are shown in the vs diagram. The paths are labelled as and . The change in internal energies during these process are taken as and and the work done as and . The correct relation between these parameters are:
Consider the following thermodynamical variables
(i) Pressure
(ii) Internal Energy
(iii) Volume
(iv) Temperature
Out of these, the intensive variable(s) is (are)
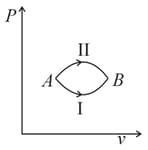
A system goes from to via two processes and shown in the figure. If and are the changes in internal energies in the processes I and Il respectively
Thermodynamic processes are indicated in the following diagram.
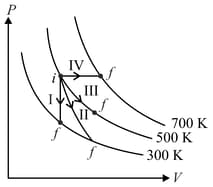
Match the following
| Column – 1 | Column - 2 |
| P. Process I | a. Adiabatic |
| Q. Process II | b. Isobaric |
| R. Process III | c. Isochoric |
| S. Process IV | d. Isothermal |
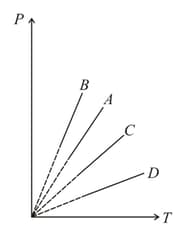
Pressure versus temperature graph of an ideal gas at constant volume is shown by the straight-line . Now mass of the gas is doubled and the volume is halved then the corresponding pressure versus temperature graph will be shown by the line
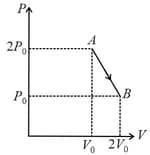
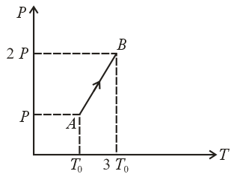
One mole of an ideal diatomic gas undergoes a transition from to along a path as shown in the figure,
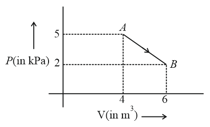
The change in internal energy of the gas during the transition is:
| Column – 1 | Column – 2 | Column – 3 |
| (I) | (i) Isothermal | (P) 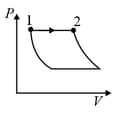 |
| (II) | (ii) Isochoric | (Q) 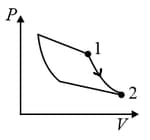 |
| (III) | (iii) Isobaric | (R) 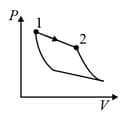 |
| (IV) | (iv) Adiabatic | (S) 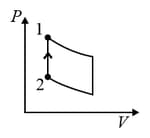 |
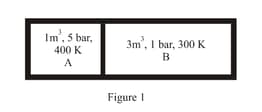
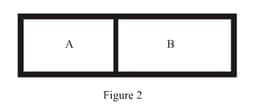
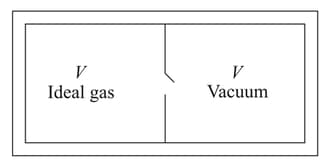
Consider the given diagram. An ideal gas is contained in a chamber (left) of volume and is at an absolute temperature It is allowed to rush freely into the right chamber of volume which is initially vacuum. The whole system is thermally isolated. What will be the final temperature, if the equilibrium has been attained?
The pressure versus temperature graph of an ideal gas is shown in the figure below. If the density of gas at point is , then the density of the gas at point will be