
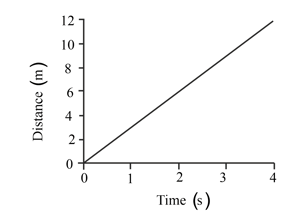
What is the average speed of the object shown in the graph below? Now add a line showing an object moving at an average speed of .
Important Questions on Measuring Motion
Why is a light gate is more accurate way of measuring time than a stopwatch?
The graph below shows the average speed of a racing car at different times as it travels around part of a race circuit. There is a time interval between each reading. Average readings over each interval have been plotted. Does the graph show the start of the race? How do you know?

The graph below shows the average speed of a racing car at different times as it travels around part of a race circuit. There is a time interval between each reading. Average readings over each interval have been plotted.
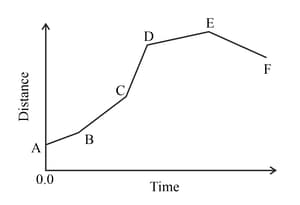
The car slows down when it reaches a corner. Which point on the graph shows where a corner could be?
The graph below shows the average speed of a racing car at different times as it travels around part of a race circuit. There is a time interval between each reading. Average readings over each interval have been plotted.

Which point on the graph shows the car at the furthest point from the start of the race? How do you know?
The graph below shows the average speed of a racing car at different times as it travels around part of a race circuit. There is a time interval between each reading. Average readings over each interval have been plotted.

What would the graph look like if the average speed were measured every th second rather than every seconds? Give a reason for your answer.
Sketch distance-time graphs for the car travelling away from its starting point at a constant speed then braking and coming to a stop.
Sketch distance-time graphs for the bike moving at a constant speed then suddenly stopping.
A student wants to find the average speed of a tortoise. She measures how far the tortoise moves every for minute. Her results are shown in table given below.
| Time (s) | Distance (m) |
Draw a distance-time graph of these results.


