
EASY
8th CBSE
IMPORTANT
Earn 100
What is the formula for calculating percentage value of a component in a pie chart?
Important Questions on Histogram, Pie Chart and Line Graph
EASY
8th CBSE
IMPORTANT
MEDIUM
8th CBSE
IMPORTANT
Draw a histogram for the following data:
| Class interval | |||||||
| Frequency |
MEDIUM
8th CBSE
IMPORTANT
The following table shows the subjects preferred by students of a school during a survey. Represent it in a pie chart.
| Subjects | Maths | Science | English | Moral Science | Social Science | Total |
| Number of students |
MEDIUM
8th CBSE
IMPORTANT
Plot the following points on a graph:
MEDIUM
8th CBSE
IMPORTANT
In which quadrants do the following points lie?
HARD
8th CBSE
IMPORTANT
| Overs | I | II | III | IV | V | VI | VII | VIII | IX | X |
| Runs |
Draw a graph to represent the above data.
EASY
8th CBSE
IMPORTANT
Ranu and Manu are two runners in a race. The graph shows the progress in a race made by them. Read the graph and answer the following question:
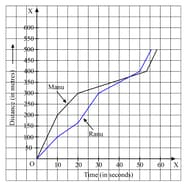
At what time were Ranu and Manu at the same level?
EASY
8th CBSE
IMPORTANT
Ranu and Manu are two runners in a race. The graph shows the progress in a race made by them. Read the graph and answer the following questions:

Did Ranu finish before Manu or Manu before Ranu?


