
What is the need of choosing a scale? If in a bar graph representing the number of students in each class, the scale is changed so as unit represents students instead of the previous , what difference will it have on the length of the bars?
Important Questions on Data Handling
What advantage do bar diagrams have over pictographs? Explain with an example.
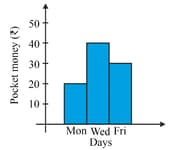
What, if anything, is wrong with the following bar graph?
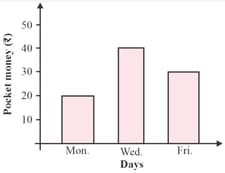
What, if anything, is wrong with the following bar graphs?
In Delhi, the following cars were sold and registered with the transport authority in a particular week.
Draw a pictograph where a picture of a car represents cars and answer the following:
| Day |
Number of cars sold and registered |
| Monday | |
| Tuesday | |
| Wednesday | |
| Thursday | |
| Friday | |
| Saturday |
On which day were the maximum number of cars sold and registered?
In Delhi, the following cars were sold and registered with the transport authority in a particular week.
Draw a pictograph where a picture of a car represents cars and answer the following:
| Day |
Number of cars sold and registered |
| Monday | |
| Tuesday | |
| Wednesday | |
| Thursday | |
| Friday | |
| Saturday |
How many pictures of cars will represent the number of cars sold and registered on Tuesday?
In Delhi, the following cars were sold and registered with the transport authority in a particular week.
Draw a pictograph where a picture of a car represents cars and answer the following:
| Day |
Number of cars sold and registered |
| Monday | |
| Tuesday | |
| Wednesday | |
| Thursday | |
| Friday | |
| Saturday |
How many cars were sold and registered during that week?
What is the minimum age required to drive a vehicle? Is it legal to drive a vehicle without a driving licence?
Milk consumption per day by each family in a colony is given below:
| Number of litres | |||||||
| Number of families |
Show this information on a bar graph. Find the quantity of milk consumed per day by maximum number of families. Also find the maximum quantity of milk consumed by a family per day. Why is milk consumption good for health?
Given alongside is a bar graph. Look at it carefully and answer the following questions:
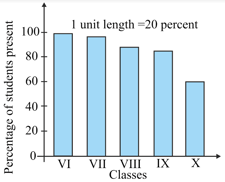
What information does the bar graph give?


