
What is the ratio of the number of females to the number of males from the HR department?
Important Questions on Graphical Representation of Data
Study the following bar graph and answer the question given below:
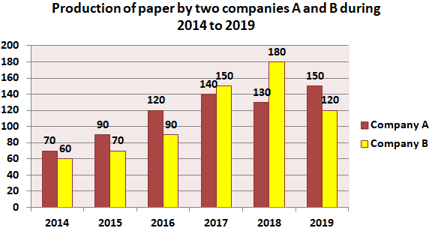
The average production of paper by Company B in less than the production of paper by Company A in the year ______.
The given bar graph shows the number of students of two schools over a period of six years.
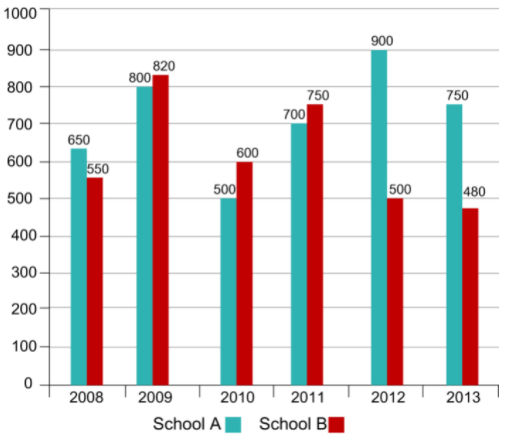
In the bar graph, what is the ratio of students taken for the years together from school A to the students taken for the years together from school B?
The given bar graph shows the number of students of two schools over a period of six years.
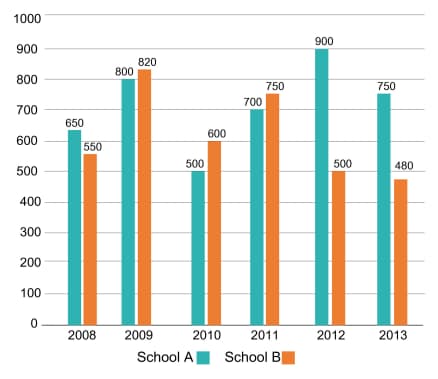
In the bar graph, what is the ratio of the average of total students from school B to the average of total students from school A?
Study the given bar graph and answer the question.
The bar graph given below represents the data of the Production of Paper (in ten lakh tonnes) by three different companies and during the years to . The -axis shows the Years and the -axis represents the Production of Paper (in ten lakh tonnes).
(Note: The data shown below is only for mathematical exercise. They do not represent the actual figures.)
Which company/companies had the maximum average production for the given five years period?
Study the given graph and answer the question that follows.
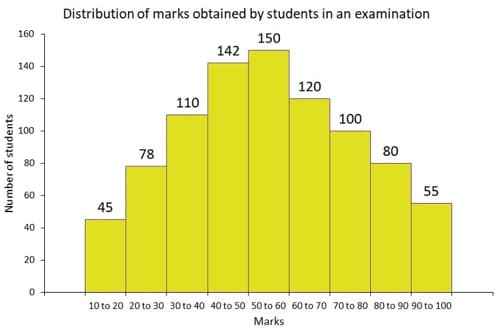
The number of students who obtained marks or more but less than marks is:
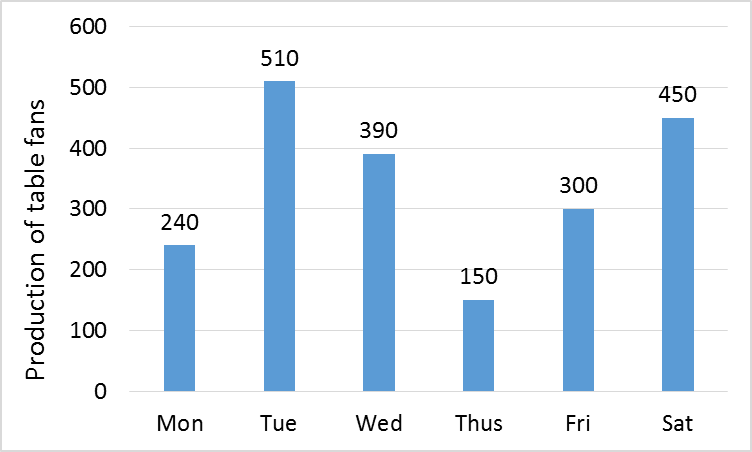
Study the given bar graph and answer the question that follows.
The bar graph shows the production of table fans in a factory during one week.
 .
.
The average production of table fans on Friday and Saturday exceeds the average production of table fans during the week by:
The given histogram shows the height of the students.
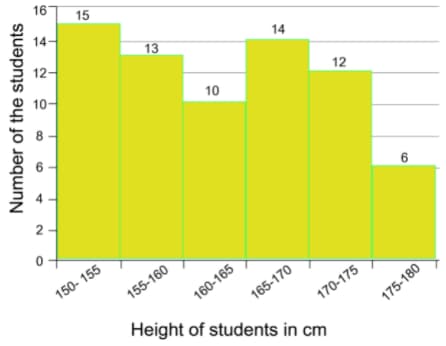
The number of students whose height is in the class interval is what percent less than the number of students whose height is in interval ? (correct to one decimal place)
Study the given bar graph and answer the question that follows.
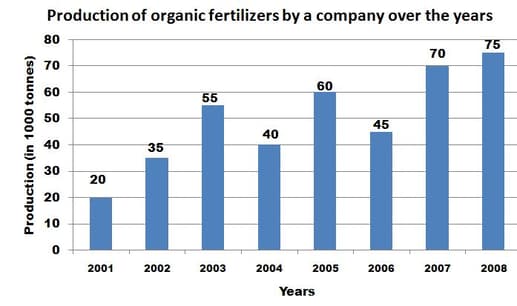
In which year was the percentage increase in production as compared to the previous year, the maximum?
Study the graph and answer the question.
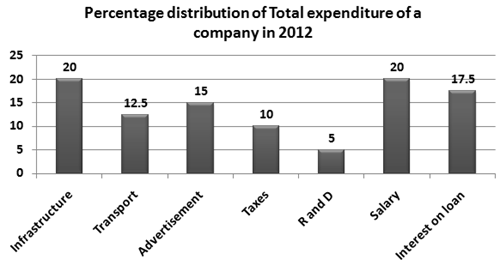
If the total amount of expenditure of the company is times the expenditure on transport, then the value of is _____.
The given bar graph shows the number of students of two schools over a period of six years.
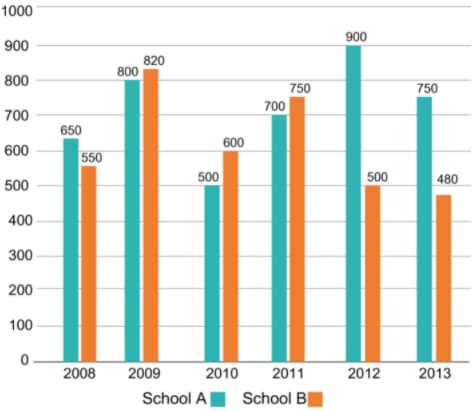
In the bar graph, in which year is the absolute difference of the students of schools A and B taken together, the maximum?
Study the given graph and answer the question that follows.
The production and export of sugar (in ) by country during to .
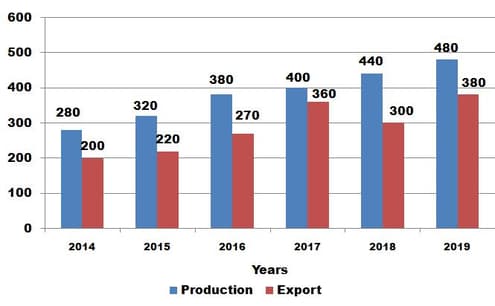
For which of the following years was the increase in the production of sugar as compared to that in its preceding year between
The given bar chart shows the details of cycle sales by a company between January and May for years and .

In the given bar-chart, which month sale shows the maximum increase in as against ?
Study the following graph and answer the question that follows.
A number of students appeared and qualified, from various colleges, at a scholarship examination.
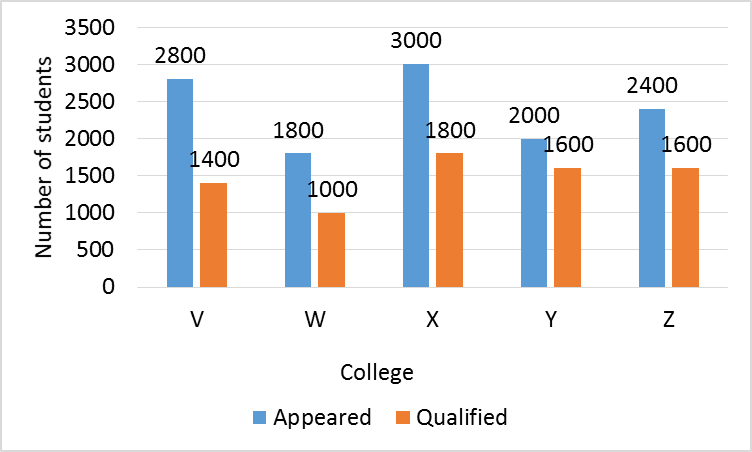 .
.
What is the difference between the average number of students that appeared for the scholarship examination from all the given colleges, and the average number of students that qualified from all the colleges together?
The bar graph shows the number of students enrolled for a vocational course in institutes and during from to .
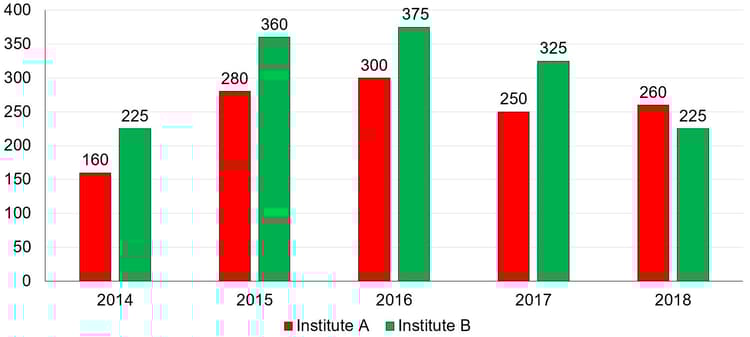
In which year, the number of students enrolled in institute is less, where , than the number of students enrolled in institute in the same year?
Study the following graph and answer the question that follows.
The number of students that appeared and qualified from various colleges at a scholarship examination.
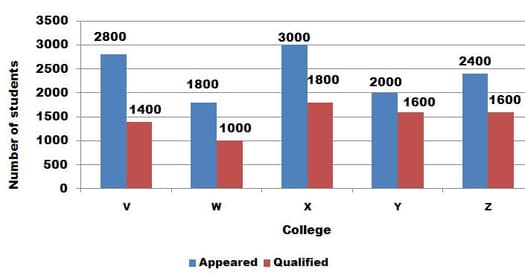
The average number of students that qualified in the examination from college is what percentage of the average number of students that appeared for the examination from the same colleges?
Study the given graph and answer the question that follows:
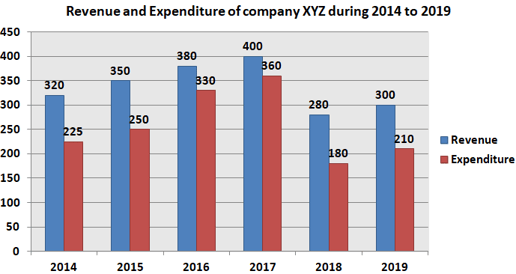
By what percentage is the average expenditure of the company in less than the revenue in ?
Study the given graph and answer the question that follows.
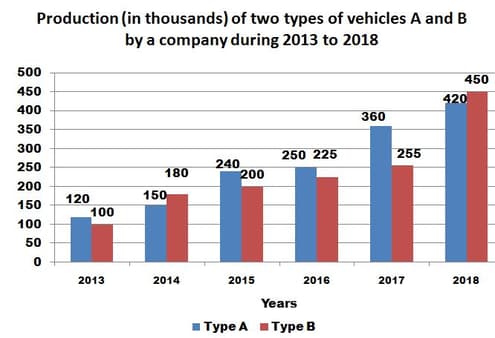
By what percentage (approximately) is the average number of vehicles of type produced in less than the number of vehicles of type produced in
The given histogram shows the height of the students.
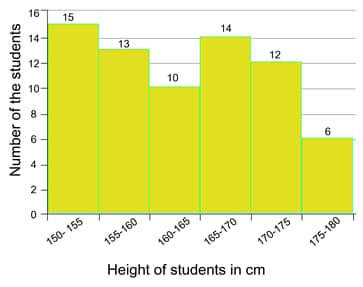
What is the percentage of students whose height is in the class interval ? (correct to the nearest integer)
The given bar chart shows the details of cycle sales by a company between January and May for years and .
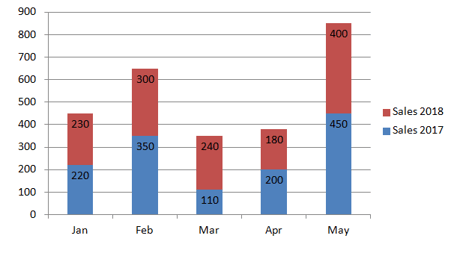
In the given bar-chart, what is the total increase or decrease in percentage sale in ?
The bar chart represents number of fiction and non-fiction books in four libraries L1, L2, L3 and L4. Consider the bar chart and answer the question based on it:
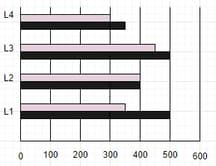
| L1 | L2 | L3 | L4 | |
| Non-Fiction (Pink) | 350 | 400 | 450 | 300 |
| Fiction (Black) | 500 | 400 | 500 | 350 |
The ratio of total books of libraries L1 and L3 to L2 and L4 is:


