
Which graph is used to represent data in continuous elements?
Important Questions on Statistics
Consider the following statements in terms of histogram:
I. The histogram is a suitable representation of a frequency distribution of a continuous variable.
II. The area included under the whole histogram is the total frequency.
Which of the above statement(s) is / are correct?
Consider the following statements in terms of histogram.
I. The total area of the rectangles in a histogram is equal to the total area bounded by the corresponding frequency polygon and the - axis.
II. When class intervals are unequal in a frequency distribution, then area of the rectangle is proportional to the frequency.
Which of the above statement(s) is/are correct?
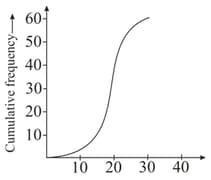
The curve given below represents a/an
A set of annual numerical data, comparable over the years, is given for the last . Consider the following statements
. The data is best represented by a broken line graph, each corner (turning point) representing the data of one year.
. Such a graph depicts the chronological change and also enables one to make a short term forecast.
Which of the above statement(s) is/are correct?
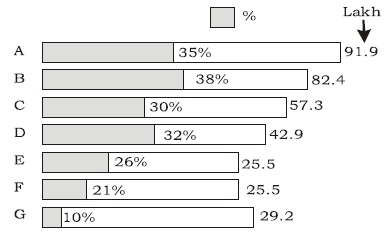
The difference in the slum populations of city G and city F is equal to_____.
Consider the following statements
The appropriate number of classes while constructing a frequency distribution should be chosen such that
The class frequency first increases to a peak and then declines.
The class frequency should cluster around the class midpoint.
Which of the above statement(s) isare correct
Consider the following statements:
. A continuous random variable can take all values in an interval.
. A random variable which takes a finite number of values is necessarily discrete.
. Construction of a frequency distribution is based on data which are discrete.
Which of the above statement(s) is/are correct?


