
MEDIUM
Earn 100
Which of the following curve will represent the variation of conductance C during titration of by gradual addition of NaOH solution (V)
50% studentsanswered this correctly
Important Questions on Redox Reactions
MEDIUM
MEDIUM
EASY
MEDIUM
EASY
The variation of molar conductively with concentration of an electrolyte (X) in aqueous solution is shown in the given figure.
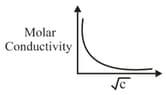
The electrolyte X is :
EASY
EASY
MEDIUM
EASY
MEDIUM
HARD
EASY
: Conductivity always increases with decreases in the concentration of electrolyte.
: Molar conductivity always increases with decreases in the concentration of electrolyte.
The correct option among the following
MEDIUM
Given below are two statements:
Statement I : The limiting molar conductivity of (strong electrolyte) is higher compared to that of $\mathrm{CH}_{3} \mathrm{COOH}$ (weak electrolyte).
Statement II : Molar conductivity decreases with decrease in concentration of electrolyte.
In the light of the above statements, choose the most appropriate answer from the options given below:
EASY
MEDIUM
Match List - I with List - II :
| List - I (Parameter) |
List - II (Unit) | ||
| (a) | Cell constant | (i) | |
| (b) | Molar conductivity | (ii) | Dimensionless |
| (c) | Conductivity | (iii) | |
| (d) | Degree of dissociation of electrolyte | (iv) |
HARD
HARD
MEDIUM
HARD


