
EASY
Earn 100
Which of the following graph represents the variation of amount of chemisorption of a gas by a solid with temperature under constant pressure?
50% studentsanswered this correctly
Important Questions on Surface Chemistry
EASY
MEDIUM
MEDIUM
EASY
Adsorption of the gas increases with:
EASY
MEDIUM
EASY
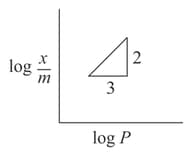
( is the mass of the gas adsorbed per gram of adsorbent)
EASY
EASY
EASY
EASY
EASY
MEDIUM
MEDIUM
(a) becomes less negative as adsorption proceeds.
(b) On a given adsorbent, ammonia is adsorbed more than nitrogen gas.
(c) On adsorption, the residual force acting along the surface of the adsorbent increases
(d) With the increase in temperature, the equilibrium concentration of adsorbate increases.
EASY
EASY
EASY
MEDIUM
Given:
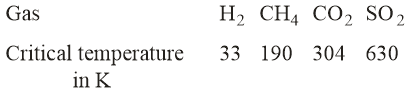
On the basis of data given above, predict which of the following gases shows the least adsorption on a definite amount of charcoal?
MEDIUM


