
Which of the following pie charts represents the data shown below?
A number of students opting for different subjects.
Subject
Number of students
English
Maths
Physics
Chemistry
Economics
Hindi
Important Questions on Data Handling
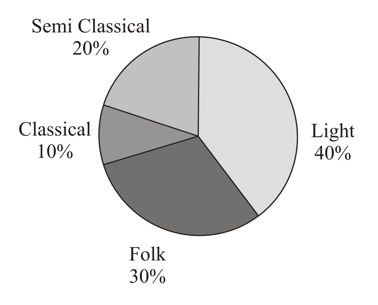
A survey was made to find the type of music that a certain group of young people liked in a city. Adjoining pie chart shows the findings of this survey. Which type of music is liked by the maximum number of people: Semi Classical / Folk / Light?
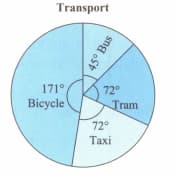
The number of people who use various forms of transport is given
In the figure below. Calculate the number of people using each transport if the total number of people is 10000
150 people had registered with a travel agency for a tour. The following table shows the languages spoken in the group. Represent the information in the form of a pie chart.
| Languages | Tamil | Hindi | Marathi | Telugu | Gujarati | Malayalam |
| Number of people |
A group of people were asked to vote for their favourite season from the three seasons, rainy, winter and summer.
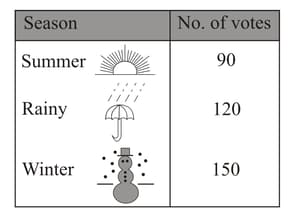
Draw a pie chart to show this information.
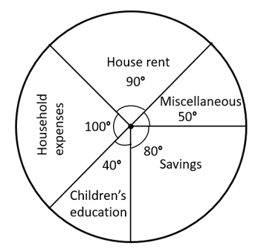
In the given pie chart, total income is then the expenditure on house rent per month is
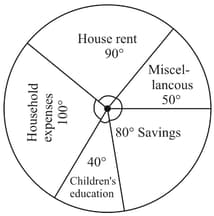
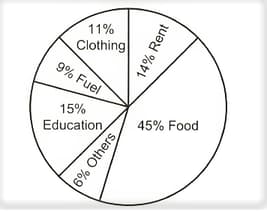
If the total income of the family is , then the amount spent on rent and food together is __________.
The adjoining pie chart gives the marks scored in an examination by a student in Hindi, English, Mathematics, Social Science and Science. If the total marks obtained by the student is , answer the following question.
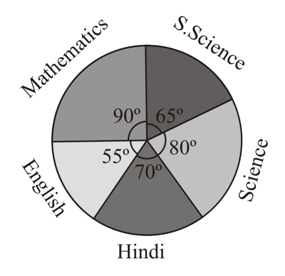
How many more marks were obtained by the student in Mathematics than in Hindi?
Draw a pie chart showing the following information. The table shows the colours preferred by a group of people.
| Colours | Number of people |
| Blue | |
| Green | |
| Red | |
| Yellow | |
| Total |
In the given pie chart, total income is , on which head is the expenditure maximum?
The given pie chart represents the production of various crops (in million tonnes) for the year of a certain state. Read the chart and answer the question that follow.
What is the ratio of the production of rice to the production of pulses?

A survey was made to find the type of music that a certain group of young people liked in a city. Adjoining pie chart shows the findings of this survey.
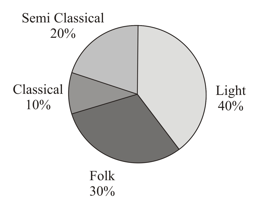
If people liked classical music, how many young people were surveyed?
Forty children were asked about their favourite types of movies. The data collected is as follows:
| Comedy | Action | Animation | Drama | Science Fiction |
| 8 | 10 | 12 | 2 | 8 |
Represent the above information in the form of a pie chart.
The given pie chart represents the valid votes obtained by four candidates for the post of president of a club in a city. Study the pie chart and answer the following questions if the total number of valid votes polled is .
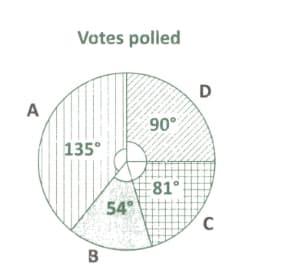
Which candidate got the least number of votes? How many votes were polled for the candidate?
A group of people were asked to vote for their favourite season from the three seasons, rainy, winter and summer.
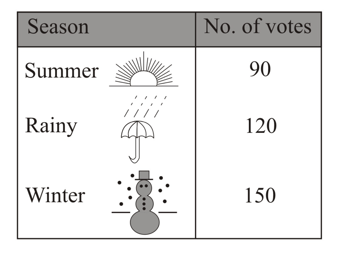
Which season got the most votes?
A class student sleeps for , is in school for , plays for , does homework for and does other activities in the remaining time of the day. The central angle of the sector that represents the time spent at school is?
The number of students in a hostel, speaking different languages is given below. Display the data in a pie chart.
| Language | Hindi | English | Marathi | Tamil | Bengali | Total |
| Number of students |
The following table represents the number of tickets in five halls at a multiplex theatre.
|
Hall |
|||||
|
Tickets sold |
Represent the information on a pie chart and answer the following questions.
Calculate the angle of the sector represented by the tickets available in Hall .
In a month, Labradors, pugs, German shepherds, Pomeranians and spa niels are sold in a pet shop. Represent the information by means of a pie chart.
A child made this Chapati Chart after asking his friends, who likes to get wet in the rain?
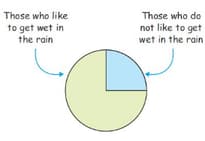
Identify the portion of the children who do not like to get wet in the rain.


