
Which of these is called a tally mark?
Important Questions on Smart Charts
Read the given bar graph carefully and fill in the blanks:

Mode of transport which is used by most number of students _____
 represent the number and
  represent the number . Write the answer in numeral.
_____
The number of flies in each jar are:
Jar Jar Jar Jar
Represent the data though tally marks
| Jar | Number of Flies | Tally Marks |
|---|---|---|
Given below is the choice of sweets of students of class .
|
Ladoo |
Barfi |
Jalebi |
Rasgulla |
Ladoo |
Ladoo |
|
Jalebi |
Ladoo |
Barfi |
Rasgulla |
Ladoo |
Jalebi |
|
Jalebi |
Rasgulla |
Ladoo |
Rasgulla |
Jalebi |
Ladoo |
|
Rasgulla |
Rasgulla |
Jalebi |
Rasgulla |
Ladoo |
Rasgulla |
|
Ladoo |
Barfi |
Ladoo |
Jalebi |
Rasgulla |
Ladoo |
(a) Arrange the names of the sweets in a table using tally marks.
Earlier there were no rabbits in Australia. Rabbits were brought to Australia around the year . At that time there were no animals in Australia who ate rabbits. So the rabbits began to multiply at a very fast rate. Imagine what they did to the crops!
The table shows how rabbits grew every year.
| Time | Number of rabbits |
| Start | |
| year | |
| year | |
| year | |
| year | |
| year | |
| year |
At the end of year , the number of rabbits were close to
Use the following information to make a tally chart.
| Grade received in art and craft team | Number of students |
| A | |
| B | |
| C | |
| D |
Read the given bar graph carefully.

Mode of transport which is used by the least number of students Car and _____(Bus/Cycle).
Different types of fish available at a pet shop.
| Types of Fish | Tally marks | |
|
Goldfish |
 |
|
|
Clown fish |
 |
|
|
Angelfish |
 |
|
|
Parrotfish |
 |


Key:  fish,
fish,  fish.
fish.
Represent the data in the form of tally marks.
Ragini loves to watch cartoons on television. One day she thought of counting the number of ads during the breaks. She found that in each break there were advertisements. In of those ads there were children as actors.
Why do you think that children are used in so many ads?
Use tally marks to count the number of ads during a short break in programme.
The given line graph shows the number of people visiting the Taj Mahal during different months.
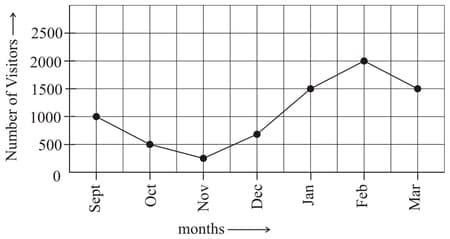
In which two months did the same number of people visit the Taj Mahal?
Given below is the choice of sweets of students of class .
|
Ladoo |
Barfi |
Jalebi |
Rasgulla |
Ladoo |
Ladoo |
|
Jalebi |
Ladoo |
Barfi |
Rasgulla |
Ladoo |
Jalebi |
|
Jalebi |
Rasgulla |
Ladoo |
Rasgulla |
Jalebi |
Ladoo |
|
Rasgulla |
Rasgulla |
Jalebi |
Rasgulla |
Ladoo |
Rasgulla |
|
Ladoo |
Barfi |
Ladoo |
Jalebi |
Rasgulla |
Ladoo |
(b) Which sweet is preferred by most of the students?
Using a tally chart, represent the following information.
| Newspaper | Number of people reading newspaper in a locality |
| Times of country | |
| Our times | |
| Hindu times | |
| Economy times | |
| Express times |
Read the given bar graph carefully and fill in the blank:
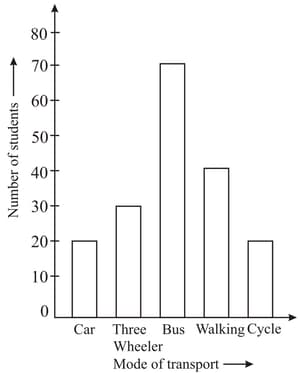
Number of students who use three wheeler _____.
The following data shows the favorite holiday destination for Class
| Place | Kochi | Agra | Goa | Simla | Ladakh |
|---|---|---|---|---|---|
| Number of Children |
Represent the data through tally marks.
Following table represents students getting A grade in various subjects of class V. Complete this table and fill in the blanks:
| Subject | Tally Marks | Number of Students |
| (a) Mathematics | _____ | |
|
(b) English |
_____ |
|
| (c) Hindi | _____ | |
| (d) Science | _____ | |
| (e) Social Science | _____ |
Represent the following through tally marks.
Number of cakes in boxes:
Box Box Box Box
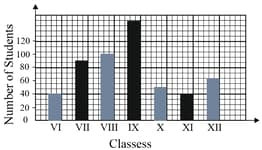
The following graph shows the number of students in each class of a school. Study the graph and match the columns given below:
| Column A | Column B |
| (a) Number of students of class equal to | (p) |
| (b) The maximum number of students is | (q) |
| (c) The difference between the maximum number off students and the minimum number of students is |
(r) |
|
(d) The difference between the number of students in classes VIII and X is |
(s) |


