HARD
JEE Main
IMPORTANT
Earn 100
Which one is the correct graph (figure) for the corresponding acid base titration?
50% studentsanswered this correctly
Important Questions on Ionic Equilibrium
HARD
JEE Main
IMPORTANT
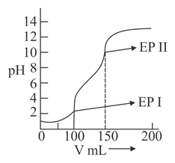
A weak acid (or base) is titrated against a strong base (or acid) and the volume V of a strong base (or acid) is plotted against the of the solution (as shown in figure). The weak electrolyte (i.e. acid or base) could be:
MEDIUM
JEE Main
IMPORTANT
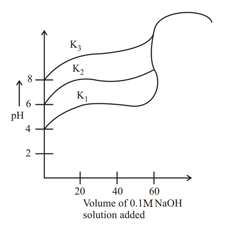
Titration curves for solutions of three weak acids and with ionization constants and respectively are plotted as shown in the figure. Which of the following is/are true?
HARD
JEE Main
IMPORTANT
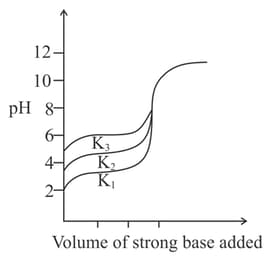
Titration curves for solutions of three weak acids and with ionization constants and , respectively as shown in figure below. The volume of added is in