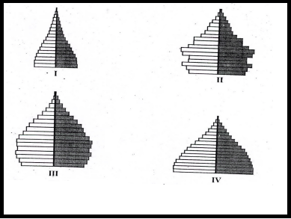
Which one of the figures represents the working age groups of the population
Important Questions on Population
Observe the following diagrams carefully.

Which one of the above population pyramids is an ideal representation of India’s population?
Column – I in the following table indicates the states of India and Column – II the sex ratio (females/per 1000 males) in 2011 census. Which one of the following is proper combination?
|
Column – I (States) |
Column – II (Sex Ratio) |
| A. Tamil Nadu | 1. |
| B. West Bengal | 2. |
| C. Maharashtra | 3. |
| D. Madhya Pradesh | 4. |
Observe the data given in the following table.
| City | Female Literacy Rate (%) | Male Literacy Rate (%) | Sex-Ratio |
| A | |||
| B | |||
| C | |||
| D |
Based on the above table, identify the city which has the extent of equality between males and females better than the rest in terms of the given parameters?
Read the statements below carefully and choose the correct option.
Statement 1: In India, the literacy rate for men is higher than that for women.
Statement 2: The sex ratio in India has always been unfavourable to females.
Statement 3: Adolescent population comprises one-fifth of the total population of India.
Read the statements below carefully and choose the correct option.
Statement 1: Age composition of a population refers to the number of people of different genders in a country.
Statement 2: Working population comprises ages 10- 55 years who are economically productive and biologically reproductive.
Statement 3: According to the Census 2011, any person aged 5 years and above who can read and write with understanding in any language is treated as literate.

