
Which one of the following graphs is/are correct for isochoric process?
Important Questions on Thermodynamics
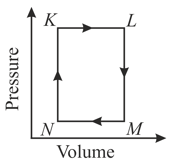
The pressure versus temperature plot of a cyclic process for an ideal gas is shown in the figure.
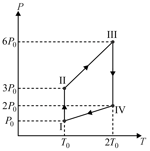
The corresponding density versus temperature plot will be
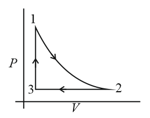
Thermodynamic process is shown below on a diagram for one mole of an ideal gas. If , then the ratio of temperature is :
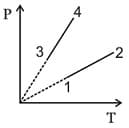
Thermodynamic processes are indicated in the following diagram.
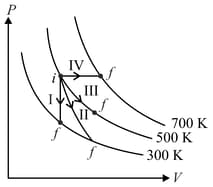
Match the following
| Column – 1 | Column - 2 |
| P. Process I | a. Adiabatic |
| Q. Process II | b. Isobaric |
| R. Process III | c. Isochoric |
| S. Process IV | d. Isothermal |
For three low density gases pressure versus temperature graphs are plotted while keeping them at constant volume, as shown in the figure
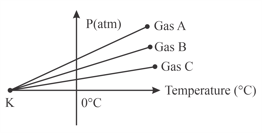
The temperature corresponding to the point is:
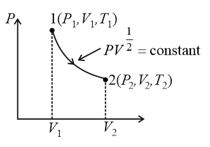
One mole of an ideal diatomic gas undergoes a transition from to along a path as shown in the figure,
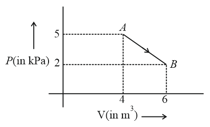
The change in internal energy of the gas during the transition is:
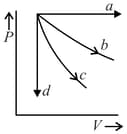
The given diagram shows four processes i.e., isochoric, isobaric, isothermal and adiabatic. The correct assignment of the processes, in the same order is given by:
The pair of isochoric processes among the transformation of states is
Pressure versus temperature graph of an ideal gas of equal number of moles of different volumes is plotted as shown in diagram. Choose the correct alternative.
Two moles of at has a volume of is supplied by of heat and temperature changed to in a closed container.
Then, which of the following statements are correct?


