
Which one of the following statements is correct regarding the qualitative type data interpretation?
Important Questions on Graphical Representation of Data
The pie-chart represented below shows the spending by a family on various items during the year . Study the pie-chart carefully and answer the following question:
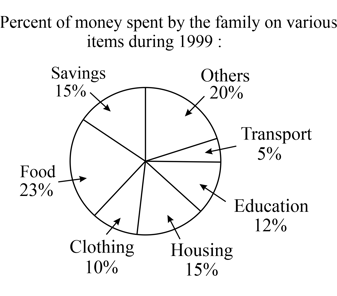
If the total expenditure of the family for the year was , then the savings (in rupees) of the family was
The pie-chart represented below shows the spending by a family on various items during the year . Study the pie-chart carefully and answer the following question:

The ratio of the total amount of money spent on housing to the total amount of money spent on education was
The pie-chart represented below shows the spending by a family on various items during the year . Study the pie-chart carefully and answer the following question:

If the total amount spent during the year was , then the amount (in rupees) spent on food was
The pie-chart represented below shows the spending by a family on various items during the year . Study the pie-chart carefully and answer the following question:

According to the pie-chart, the maximum amount was spent on which item?
The pie-chart represented below shows the spending by a family on various items during the year . Study the pie-chart carefully and answer the following question:

If the total amount spent during the year was then how much money (in rupees) was spent on clothing and housing together?
Increased performance in the beginning but gradual decline later is indicated by:
Bar diagram which shows the production of electronic equipment from 2003 to 2007.
Production of Electronic Equipment (in )
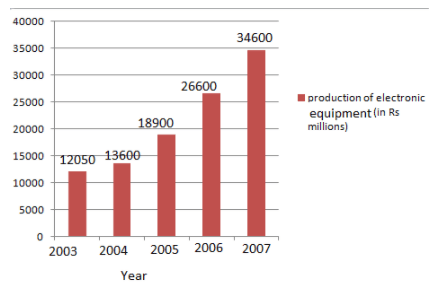
The average annual increase in the value of production (in ) for the given period is equal to _____.
Decreased performance in the beginning but gradual improvement is indicated by:
"These days, prices have started rising."
Which amongst the following graphs represents this situation?
The marks (out of ) obtained by students in a mathematics test are listed as below:
The number of students who obtained marks more than or equal to is ____
Which of the following teaching-learning resources is best suited to explain the concept of multiplication of two decimal numbers say


