
Write the advantages of using pictographs.
Important Questions on Data Handling and Presentation
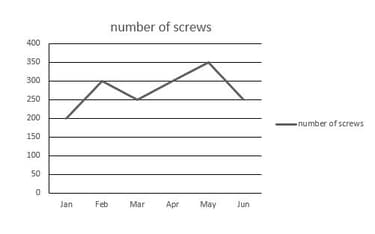
According to the chart below, in which month less than screws were manufactured?
The equation of the graph shown here is:

Height of the students of Class is shown below:
| Height | ||||||||||||
| No. of students |
Represent this information by placing faces in place of numbers for the above information and answer the following question:
How many students have the minimum height?
The number of fans sold by a shopkeeper during months are given below:
| Month | March | April | May | June | July | August |
| Number of fans sold |
Taking the scale  fans sold, draw the pictograph.
In a school, the number of students in different classes of primary wing are as follows:
Represent this information through a pictograph using the symbol  to represent students.
| Class | I | II | III | IV | V |
| No. of students |
Which other geometrical figure can be used to represent students?
Total number of animals in five villages are as follows:
Village A : Village B :
Village C : Village D :
Village E :
Prepare a pictograph of these animal using one symbol to represent animals and answer the following question:
Which village has more animals village A or village C?
In a school, the number of students in different classes of primary wing are as follows:
Represent this information through a pictograph using the symbol  to represent students.
| Class | I | II | III | IV | V |
| No. of students |
How many circles will represent the students of Class ?
In Delhi, the following cars were sold and registered with the transport authority in a particular week.
Draw a pictograph where a picture of a car represents cars and answer the following:
| Day |
Number of cars sold and registered |
| Monday | |
| Tuesday | |
| Wednesday | |
| Thursday | |
| Friday | |
| Saturday |
How many cars were sold and registered during that week?
What is the minimum age required to drive a vehicle? Is it legal to drive a vehicle without a driving licence?
There needs to be at least _____ columns in a pictograph.
In a school, the number of students in different classes of primary wing are as follows:
Represent this information through a pictograph using the symbol  to represent students.
| Class | I | II | III | IV | V |
| No. of students |
How many circles will represent the students of class ?
The number of stools in five rooms of a school are given below:
| Room number | |||||
| Number of stools |
Taking the scale  stools, draw the pictograph.
A pictograph given below shows the number of visitors in Red Fort during a week:
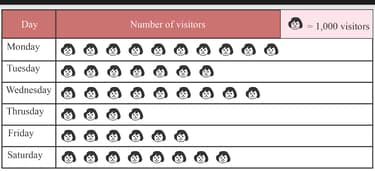
Find the total number of visitors during the week?
In Delhi, the following cars were sold and registered with the transport authority in a particular week.
Draw a pictograph where a picture of a car represents cars and answer the following:
| Day |
Number of cars sold and registered |
| Monday | |
| Tuesday | |
| Wednesday | |
| Thursday | |
| Friday | |
| Saturday |
On which day were the maximum number of cars sold and registered?
Birthday chart of the students of class is shown below:
| Month | Apr | May | Jun | Jul | Aug | Sep | Oct | Nov | Dec | Jan | Feb | Mar |
| No. of students |
Represent this information by placing faces in place of numbers in order to draw a pictograph of the above information.
In which month do maximum birthdays fall?
In Delhi, the following cars were sold and registered with the transport authority in a particular week.
Draw a pictograph where a picture of a car represents cars and answer the following:
| Day |
Number of cars sold and registered |
| Monday | |
| Tuesday | |
| Wednesday | |
| Thursday | |
| Friday | |
| Saturday |
How many pictures of cars will represent the number of cars sold and registered on Tuesday?
In a class test, the number of students passed in various subjects are given below.
| Subject | English | Mathematics | Hindi | Drawing |
| Number of students passed |
Taking the scale  successful students, draw the pictograph.
A pictograph given below shows the number of visitors in Red Fort during a week:
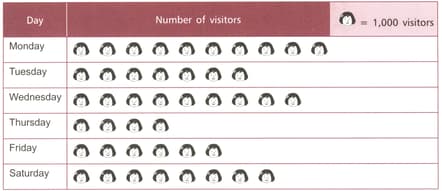
On which day was the number of visitors minimum?
Birthday chart of the students of class is shown below:
| Month | Apr | May | Jun | Jul | Aug | Sep | Oct | Nov | Dec | Jan | Feb | Mar |
| No. of students |
Represent this information by placing faces in place of numbers in order to draw a pictograph of the above information.
Is there a month in which none of the students have their birthday?
The beginning of a pictograph should have a _____ of what it represents.
_____ is a graph that uses pictures to represent data. (Bar Graph/ Pictograph)


