
Write two disadvantages of pie chart.
Important Questions on Statistics
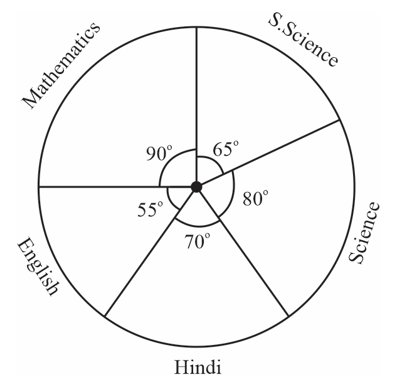
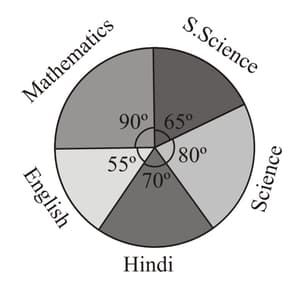
The adjoining pie chart gives the marks scored in an examination by a student in Hindi, English, Mathematics, Social Science and Science. If the total marks obtained by the student is . In which subject did the student score marks?
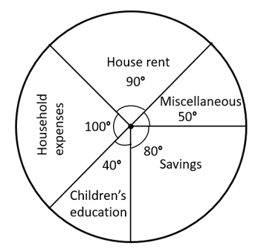
The pie-chart given here shows expenditure incurred by a family on various items. Their savings amounts to in a month.

The expenditure incurred on education is
In the given pie chart, total income is , on which head is the expenditure maximum?
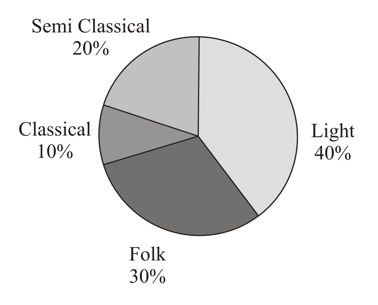
A survey was made to find the type of music that a certain group of young people liked in a city. Adjoining pie chart shows the findings of this survey. Which type of music is liked by the maximum number of people: Semi Classical / Folk / Light?
The pie-chart given here shows expenditure incurred by a family on various items and their savings, which amount to in a month. Study the chart.

The total expenditure of the family for the month is
The following data gives the amount spent on the construction of a house. Draw a pie chart.
| Item | Cement | Timber | Bricks | Labour | Steel | Misc. |
|---|---|---|---|---|---|---|
| Expenditure (in thousands) |
The adjoining pie chart gives the marks scored in an examination by a student in Hindi, English, Mathematics, Social Science and Science. If the total marks obtained by the student is , examine whether the sum of the marks obtained in Social Science and Mathematics is more than that in Science and Hindi.
Draw a pie chart showing the following information. The table shows the colours preferred by a group of people.
| Colours | Number of people |
| Blue | |
| Green | |
| Red | |
| Yellow | |
| Total |
The number of students interested in taking part in various hobbies from class of a particular school is as under.
| Hobby | Music | Pottery | Dance | Drama | Social service |
|---|---|---|---|---|---|
| Number of students |
Represent the above data by Pie chart.
A group of people were asked to vote for their favourite season from the three seasons, rainy, winter and summer.
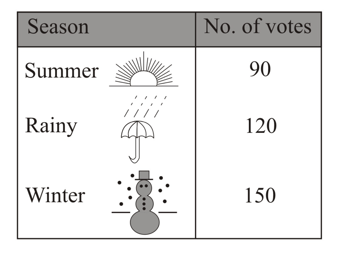
Which season got the most votes?
A survey was made to find the type of music that a certain group of young people liked in a city. Adjoining pie chart shows the findings of this survey.
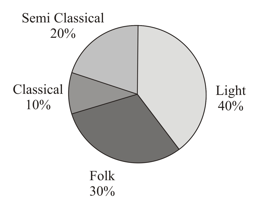
If people liked classical music, how many young people were surveyed?
The expenditure of a firm under different heads in term of percentage expenditure is given below. Draw a pie chart.
| Items | Wages | Rent | Maintenance | Miscellaneous |
|---|---|---|---|---|
| Percentage |
The adjoining pie chart gives the marks scored in an examination by a student in Hindi, English, Mathematics, Social Science and Science. If the total marks obtained by the student is , answer the following question.
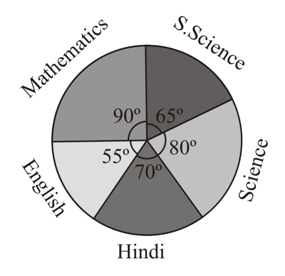
How many more marks were obtained by the student in Mathematics than in Hindi?
In the given pie chart, total income is then the expenditure on house rent per month is
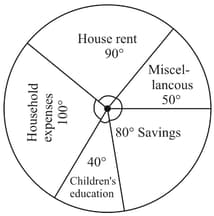
The pie-chart given here shows expenditure incurred by a family on various items and their savings, which amount to in a month. Study the chart.
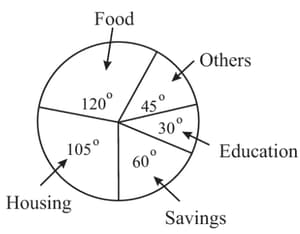
The more amount spent on food than on housing is
The number of students in a hostel, speaking different languages is given below. Display the data in a pie chart.
| Language | Hindi | English | Marathi | Tamil | Bengali | Total |
| Number of students |
A class student sleeps for , is in school for , plays for , does homework for and does other activities in the remaining time of the day. The central angle of the sector that represents the time spent at school is?
The number of students in a hostel speaking different languages is given below. Represent the data in a pie chart.
| Languages | Hindi | English | Marathi | Tamil | Bengali | Total |
|---|---|---|---|---|---|---|
| Number of students |
A group of people were asked to vote for their favourite season from the three seasons, rainy, winter and summer.
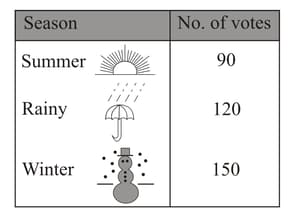
Draw a pie chart to show this information.


