. Use the normal approximation to find:
Important Questions on The Normal Distribution
Which of the following is not true regarding the normal distribution?
If in a population of size ”N” the birth rate is represented as “b” and the death rate as “d”, the increase or decrease in “N” during a unit time period ”t” will be:

The equation given above can also be represented as:

What does ”r” represent. Write any one significance of calculating ”r” for any population?
Use a normal approximation to find the probability of there being fewer than cloudy days in Scotland in November ( days).
Find the range, the three quartiles and the interquartile range for data represented by the following box-and-whisker plots.

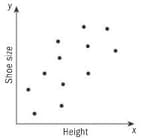
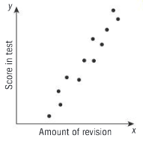
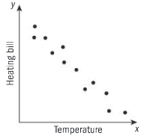
For each scatter plot, describe the form, direction and strength of the association between the variables. Interpret your description in the context of the data.
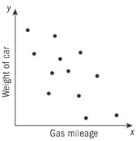
For each scatter plot, describe the form, direction and strength of the association between the variables. Interpret your description in the context of the data.
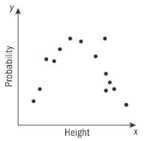
For each scatter plot, describe the form, direction and strength of the association between the variables. Interpret your description in the context of the data.
Find the range, the three quartiles and the interquartile range for data represented by the following box-and-whisker plots.

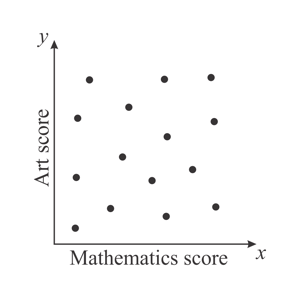
For each scatter plot, describe the form, direction and strength of the association between the variables. Interpret your description in the context of the data.
The times of sunrise and of sunset in Reykjavik, Iceland, on the of each month are represented in this table using hours and minutes.
| Month(t) | Rise | set |
| 0 | 11.20 | 15.42 |
| 1 | 10.09 | 17.13 |
| 2 | 8.37 | 18.43 |
| 3 | 6.47 | 20.16 |
| 4 | 5.01 | 21.49 |
| 5 | 3.24 | 23.27 |
| 6 | 3.05 | 23.57 |
| 7 | 4.34 | 22.34 |
| 8 | 6.09 | 20.47 |
| 9 | 7.35 | 19.00 |
| 10 | 9.09 | 17.13 |
| 11 | 10.44 | 15.49 |
Calculate the times in decimal notation. Explain why this is necessary.
Why is 'r' an important parameter?
For each scatter plot, describe the form, direction and strength of the association between the variables. Interpret your description in the context of the data.
Arable land is land that is used for growing crops. The amount of arable land can indicate how able a country is to produce food to support its citizens countries with the highest percentage of arable land (as a percentage of total land area) are listed in the table below.
| Higher-income countries | Lower-income countries | ||
| Denmark | 58% | Bangladesh | 59% |
| Hungary | 49% | Ukraine | 56% |
| Czech Republic | 41% | Moldova | 55% |
| Isle of Man | 39% | India | 53% |
| Lithuania | 38% | Togo | 49% |
| Poland | 36% | Burundi | 47% |
| Germany | 34% | Rwanda | 47% |
| France | 34% | The Gambia | 44% |
Find the five-number summaries for the high and low income countries.Round to the nearest tenth where necessary.
For each scatter plot, describe the form, direction and strength of the association between the variables. Interpret your description in the context of the data.
Represent the union of two sets by Venn diagram for each of the following.
is a prime number between and
is an odd number between and


