Zara weighted the contents of fifteen different bags of nuts and recorded their mass to the nearest gram. Draw a box-and-whisker plot to display the data.
Important Questions on Averages and Measures of Spread
The range and quartiles of a data set are given below. Use these figures to draw a box-and -whisker plot.
Range :
The table shows the marks that the same group of ten students received for three consecutive assignments. Draw three box-and-whisker plots on the same scale to display this data and use the diagrams to comment on the performance of this group of students in the three assigments.
| TEST | ||||||||||
| TEST | ||||||||||
| TEST |
The following box-and whisker plot shows the distances in kilometers that various teachers travel to get school each day.
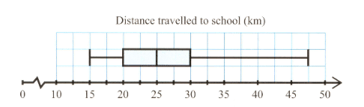
What is the median distance travelled ? What is the furthest that a teacher has to travel?
The following box-and whisker plot shows the distances in kilometres that various teachers travel to get school each day.
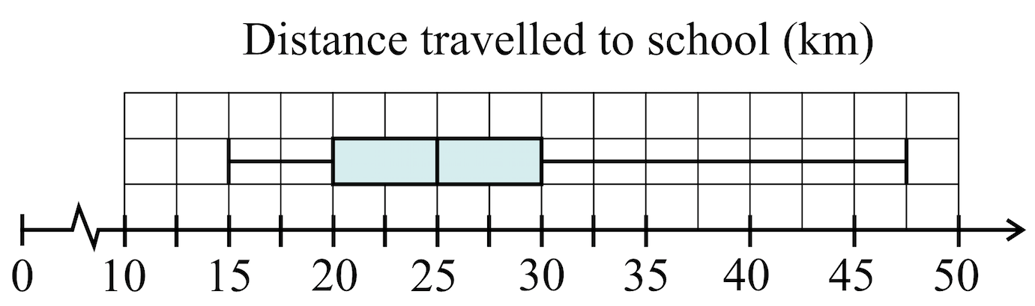
What percentage of the teachers travel or fewer kilometres to work ? What percentage of the teachers travel between and kilometre to work?
The following box-and whisker plot shows the distances in kilometres that various teachers travel to get school each day.

What is the of this data set?. What does the position of the median in the box tell you about the distribution of the data?
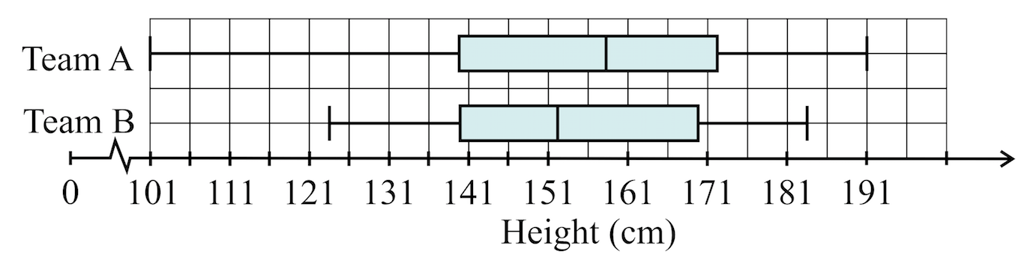
Two teams of friends have recorded their scores on a game and created a pair of box-and-whisker plots . What is the interquartile range for team
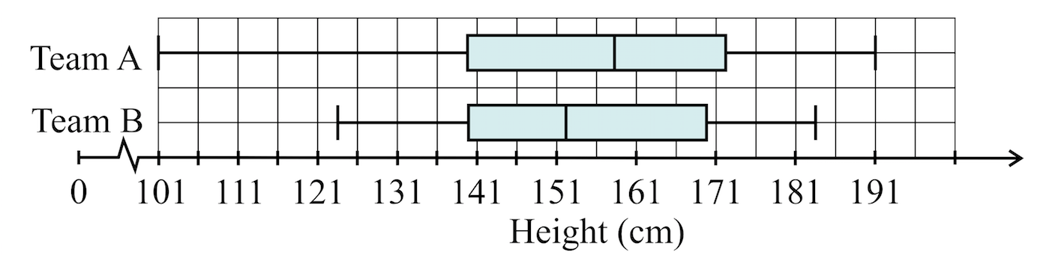
Two teams of friends have recorded their scores on a game and created a pair of box-and-whisker plots . Which team has the most consistent scores? To stay in the game , you must score at least . Which team seems most likely to stay in?

Two teams of friends have recorded their scores on a game and created a pair of box-and-whisker plots . Which team gets the highest scores ? Give reasons for your answer.