
Pictorial Representation of Data: Pie Diagram
Pictorial Representation of Data: Pie Diagram: Overview
This topic covers concepts such as Reading a Pie Chart, Pie Chart of Data, Understanding Pie Charts with Values in Degrees, Understanding Pie Charts with Values in Percentages or Fractions, Drawing Pie Charts with Given Data, etc.
Important Questions on Pictorial Representation of Data: Pie Diagram
Study the following pie chart carefully and answer the questions based on it.

The pie chart shows how the school fund is spent under different heads in a certain school. Using the pie chart answer the questions.
What is the ratio of expenditure on the library to that on science?
Study the following pie chart carefully and answer the questions based on it.
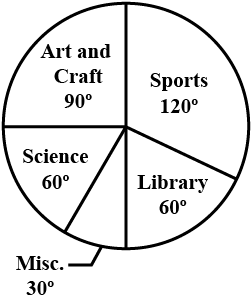
The pie chart shows how the school fund is spent under different heads in a certain school. Using the pie chart answer the questions.
What is the ratio of expenditure on sports to that on art and craft?
The following pie-chart shows the percentage distribution of the expenditure incurred in publishing books. Study the pie-chart and answer the question based on it.
Various Expenditures (in percentage) Incurred in Publishing a book:
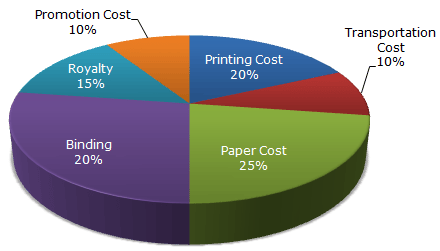
If the central angle of the sector corresponding to the expenditure incurred on Royalty is , then find the value of
In a company there are workers of different religions. The data of the different religion are given below:
| Religion | Number of workers |
| Hindu | |
| Muslim | |
| Sikh | |
| Christian |
Represent the above data by a pie graph in degrees.
Various modes of transport used by students in a given school are given below
| Mode of transport | Number of students |
| School bus | |
| Private bus | |
| Bicycle | |
| Rickshaw | |
| on foot |
Represent the above data by a pie graph in degrees.
Draw a pie chart of the data in degrees given below.
The time spent by a child during a day:
| Activity | Time spent |
| Sleep | hours |
| School | hours |
| Home-work | hours |
| Play | hours |
| others | hours |

The above Pie chart is divided into equal parts. It represents the different number of coins in Ajay's Piggy Bank, then answer the below question: If the number of total coins is .
Tell the number of coins of ?

The above Pie chart is divided into equal parts. It represents the different number of coins in Ajay's Piggy Bank, then answer the below question: If the number of total coins is .
How many coins of are there?
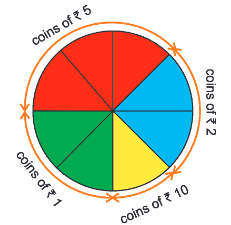
The above Pie chart is divided into equal parts. It represents the different number of coins in Ajay's Piggy Bank, then answer the below question: If the number of total coins is .
How many coins of are there? (In fraction)
The pie chart shows the number of students who drank water, milk, juices and soft drinks. Observe the graph.
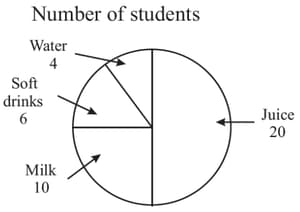
How many students are shown in all?
The number of varieties of ice-cream in an ice-cream parlour is given below as a pie chart.
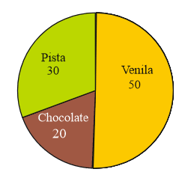
The total number of chocolate and pista ice creams is _____.
Flowers are planted in a circular area in the courtyard of Panchayat Bhavan. In half the area there is rose, one-third area of marigold and dahlia plants in the rest. Represent this by a pie graph.
Draw a pie chart for the following information.
| Ocean | Pacific | Atlantic | Indian | Arctic | Antarctic |
| Water |
Same pie chart can be used for different samples.
Pie charts are easy to understand.
A rupee spent in a cloth manufacturing company is distributed as follows. Represent this in a pie chart.
| Particulars | Paise |
| Farmer | |
| Spinner | |
| Dyer | |
| Weaver | |
| Printer | |
| Salary |
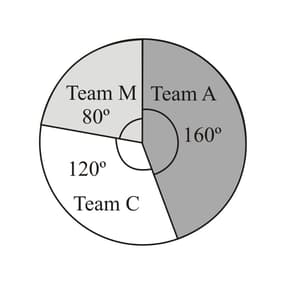
The pie chart shows goals which are scored by three football teams. Team , Team and Team . How many goals were scored by Team ?
The following table shows the expenditure in percentage incurred on the construction of a house. Represent the data in a pie chart.
| Item | Brick | Cement | Steel | Labour | Miscellaneous |
| Expenditure (in%) |
15% | 20% | 10% | 25% | 30% |
The central angle in a pie chart for an item which is of the whole is _____.
The given pie chart shows the percentages of blood types for a group of people.
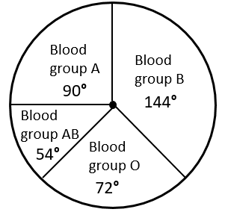
How many people in this group have blood type ?


