
Introduction to Data Handling
Introduction to Data Handling: Overview
This topic covers concepts such as Data Handling, Data, Collection or Recording of Data, Advantages of Recording Data in the Right Format, Organising Data and Importance of Organising Recorded Data.
Important Questions on Introduction to Data Handling
Which of these would be a good question to ask to find about people's eating habits?
Julian runs a bookshop. The table shows the number of books purchased by each of his last customers.
| Number of books | ||||||||||
| Number of customers |
Calculate the median number of books purchased by these customers.
Twenty-Five cards were picked up from a pack of cards one by one. The cards picked up are as follows:
Spade, Club, Spade, Club, Spade, Spade, Club, Diamond, Heart, Club, Diamond, Club, Diamond, Club, Diamond, Spade, Diamond, Club, Spade, Diamond, Heart, Diamond, Heart, Club, Heart
What is the frequency of diamond?
Number of people in various age groups in a town is given in the following table:
| Age Group | above | |||||
| Number of people |
How many senior citizens are there in the town?
Number of people in various age groups in a town is given in the following table:
| Age Group | above | |||||
| Number of people |
How many age groups have the same population?
The number of story books read by friends in a year is as follows. Show the tally marks for the number of books read, for each friend.
Manish: Alka: Ayesha: Harjit:
The final marks obtained in Mathematics by students are as follows:
What is the range?
Kate made a tally table of the ice-cream cones sold to Kate’s Ice-Cream Parlour during a weekend in May. Use the given data to draw a pictograph.
(scale:  = 5)
= 5)
| Tally mark | III III III III III III |
III III III III III III III |
III III III III III |
III III III III |
III III III |
| Variety of ice cream cones |
Vanilla | Chocolate | Strawberry | Pineapple | Cherry |
Ms Jennifer collected data from the students of class V on their favourite animals. She presented the same using tally marks.
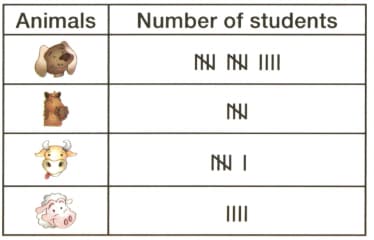
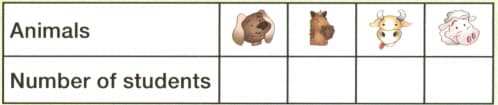
Now represent the above data using a pictograph.
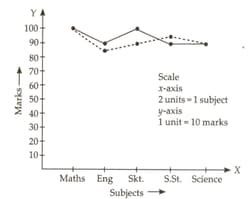
Tanvishi is one of the best students. Her predicted marks in class and her actual marks are shown in the graph.
The dotted line represents the predicted marks and the solid line represents the actual marks. In _____ she got more marks than the predicted marks.
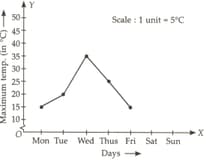
The graph given below shows the maximum temperature during the last week of April. The maximum temperature was on
Match List-I with List-II.
| List-I | List-II |
| The collection of observations is called | Organising data |
| Entry in data is called | Raw data |
| The collection of observations collected initially is called | data |
| Data handling means | Observation |
Monthly savings (in rupees) of students of class are as follows:
The frequency of the observation is
Given class intervals then is considered in the class
The number of times a particular observation occurs is called its
Find the odd word from the given options:


