Jitender Gupta and Divya Malik Solutions for Exercise 6: ARCHIVES (Last 8 Years)
Jitender Gupta Mathematics Solutions for Exercise - Jitender Gupta and Divya Malik Solutions for Exercise 6: ARCHIVES (Last 8 Years)
Attempt the practice questions from Exercise 6: ARCHIVES (Last 8 Years) with hints and solutions to strengthen your understanding. All In One ICSE Mathematics Class 10 solutions are prepared by Experienced Embibe Experts.
Questions from Jitender Gupta and Divya Malik Solutions for Exercise 6: ARCHIVES (Last 8 Years) with Hints & Solutions
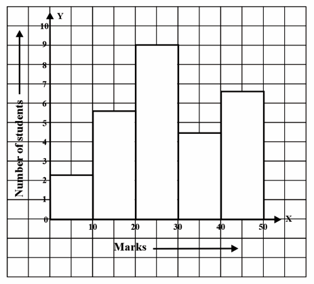
The histogram adjacent represents the score obtained by students in a Mathematics mental test. Use the data to determine the modal class.

Calculate the mean of the distribution given below using the shortcut method.
| Marks | |||||||
| Number of students |
Use a graph paper for this question, the daily pocket expenses of students in a school are given below.
| Pocket expenses (in ) | ||||||||
| Number of students (frequency) |
Draw a histogram representing the above distribution and estimate the mode from the graph.
Find the mean of the following distribution by step deviation method.
| Class interval | ||||||
| Frequency |
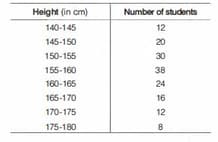
The following distribution represents the height of students of a school.
Draw an ogive for the given distribution taking of height on one axis and students on the other axis.
Using the graph, determine the median height.
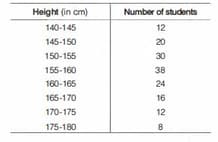
The following distribution represents the height of students of a school.
| Height (in cm) | Number of students |
Draw an ogive for the given distribution taking of height on one axis and students on the other axis.
Using the graph, the interquartile range
The following distribution represents the height of students of a school.
Draw an ogive for the given distribution taking of height on one axis and students on the other axis.
Using the graph, if above is considered as the tall boys of the class. Find the number of boys in the class who are tall.
Find the mean of the following frequency distribution by assumed method up to two decimal places.
| Class interval | Frequency |


