
Abhishek Chauhan and Vivek Singhal Solutions for Chapter: Introduction to Graphs, Exercise 4: Chapter Test
Abhishek Chauhan Mathematics Solutions for Exercise - Abhishek Chauhan and Vivek Singhal Solutions for Chapter: Introduction to Graphs, Exercise 4: Chapter Test
Attempt the practice questions on Chapter 15: Introduction to Graphs, Exercise 4: Chapter Test with hints and solutions to strengthen your understanding. All In One MATHEMATICS CBSE Class 8 solutions are prepared by Experienced Embibe Experts.
Questions from Abhishek Chauhan and Vivek Singhal Solutions for Chapter: Introduction to Graphs, Exercise 4: Chapter Test with Hints & Solutions
If the simple interest on a certain sum is per year. Then, , where is the number of years.
Draw a graph for the above function.
If the simple interest on a certain sum is per year. Then, , where is the number of years.
From the graph, find the value of , when, and
Draw a histogram to represent the following data.
| Class Interval | |||||
| Frequency |
If and coordinates are related to , then draw the graph by taking and , also find the values of when and .
Plot the points and on a graph paper.
The following graph shows the marks in Mathematics scored by the pupils of class . Study the graph and answer the following question that follows.

How many pupils scored marks?
The following graph shows the marks in Mathematics scored by the pupils of class . Study the graph and answer the following question that follows.
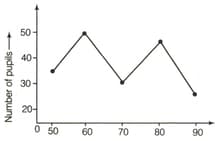
How many more pupils scored than those who scored ?
Use the table below to draw the linear graph, also find the number of days a hillside city received snow in different years.
| Years | ||||
| Days |


