
Abhishek Chauhan and Vivek Singhal Solutions for Chapter: Introduction to Graphs, Exercise 2: Topic Exercise 15.2
Abhishek Chauhan Mathematics Solutions for Exercise - Abhishek Chauhan and Vivek Singhal Solutions for Chapter: Introduction to Graphs, Exercise 2: Topic Exercise 15.2
Attempt the practice questions on Chapter 15: Introduction to Graphs, Exercise 2: Topic Exercise 15.2 with hints and solutions to strengthen your understanding. All In One MATHEMATICS CBSE Class 8 solutions are prepared by Experienced Embibe Experts.
Questions from Abhishek Chauhan and Vivek Singhal Solutions for Chapter: Introduction to Graphs, Exercise 2: Topic Exercise 15.2 with Hints & Solutions
Plot the following points on the graph.
and
Draw a graph for the following:
| Distance(in meters) | ||||||
| Time(in seconds) |
Is it a linear graph?
Draw a line graph from the following table(monthly output of a tin mine):
|
Months |
June | July | Aug | Sep | Oct | Nov | Dec |
| Output of tin mine(in tonne) |
What is the largest monthly output of the tin mine?
Draw a line graph from the following table(monthly output of a tin mine):
|
Months |
June | July | Aug | Sep | Oct | Nov | Dec |
| Output of tin mine(in tonne) |
For which months do the output remain constant?
Plot the given points on a graph sheet and check, if the points lie on a straight line. If not, name the shape they form when joined in the given order and .
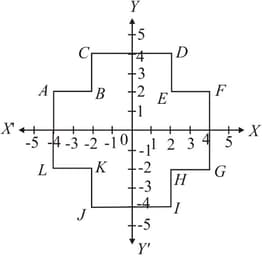
Write the coordinates of the vertices of the following figure.
Draw a line graph from the following data.
Find the value of , when .
Draw a line graph from the following data.
Find the value of , when .


