
M L Aggarwal Solutions for Exercise 3: EXERCISE 20.3
M L Aggarwal Mathematics Solutions for Exercise - M L Aggarwal Solutions for Exercise 3: EXERCISE 20.3
Attempt the practice questions from Exercise 3: EXERCISE 20.3 with hints and solutions to strengthen your understanding. Understanding ICSE Mathematics Class 9 solutions are prepared by Experienced Embibe Experts.
Questions from M L Aggarwal Solutions for Exercise 3: EXERCISE 20.3 with Hints & Solutions
Draw a histogram to represent the following data:
| Marks obtained | ||||||
| Number of students |
Draw a histogram and frequency polygon for the following data
| Class marks | ||||||
| Frequency |
In a class of 90 students, the marks obtained in a weekly test were as under.
| Marks | |||||||
| No. of students |
In a city, the weekly observations made in a study on the cost of living index are given in the following table:
| Cost of living index | Number of weeks |
| Total |
Draw a frequency polygon for the data given above.
The water bills of houses in a locality are given below:
Taking class interval . from frequency distribution table, construct a combined histogram and frequency polygon.
The number of matchsticks in boxes on counting was found as given below:
Taking classes construct the frequency distribution table for the above data. Also draw a combined histogram and frequency polygon to represent the distribution.
The histogram showing the weekly wages (in ) of workers in a factory is given alongside.
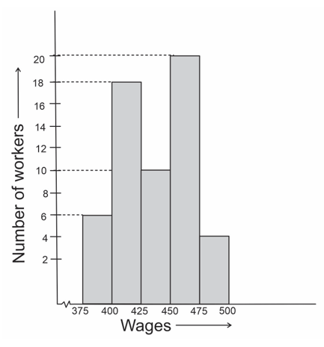
What is the frequency of class ?
The histogram showing the weekly wages (in ) of workers in a factory is given alongside.
What is the class having a minimum frequency?


