
Karen Morrison and Nick Hamshaw Solutions for Exercise 8: Exercise 21.8
Karen Morrison Mathematics Solutions for Exercise - Karen Morrison and Nick Hamshaw Solutions for Exercise 8: Exercise 21.8
Attempt the practice questions from Exercise 8: Exercise 21.8 with hints and solutions to strengthen your understanding. Cambridge IGCSE® Mathematics Core and Extended Coursebook Second Edition solutions are prepared by Experienced Embibe Experts.
Questions from Karen Morrison and Nick Hamshaw Solutions for Exercise 8: Exercise 21.8 with Hints & Solutions
The following distance-time graph represents Ibrahim's journey from home to school one morning.
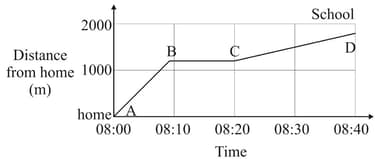
Write how far was Ibrahim from home at hours?
The following distance-time graph represents Ibrahim's journey from home to school one morning.

Calculate how fast, in , was Ibrahim travelling during the first minutes?
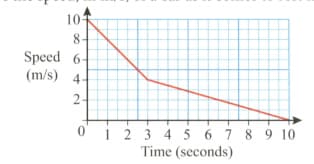
The graph below shows the speed, in m/s, of a car as it comes to rest from a speed of m/s.

Calculate the rate at which the car is slowing down during the first three seconds.
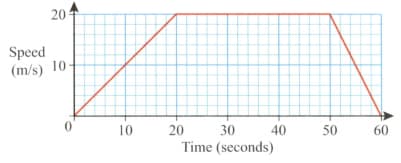
The graph below shows the speed, in m/s, of a car as it comes to rest from a speed of m/s.
Calculate the distance travelled during the second period shown on the graph.
The graph below shows the speed, in m/s, of a car as it comes to rest from a speed of m/s.

Calculate the average speed of the car for this second period.
The diagrams below is the speed-time graph for a car journey.
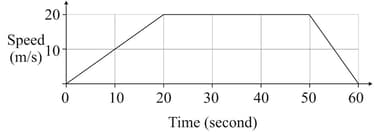
Calculate the acceleration during the first 20 seconds of the journey.
The diagram below is the speed-time graph for a car journey.

Calculate the acceleration during the last seconds of the journey.
The diagram below is the speed-time graph for a car journey.
Calculate the average speed for the whole journey.


