
Asish Kumar Solutions for Chapter: Data Handling, Exercise 3: Exercise
Asish Kumar Mathematics Solutions for Exercise - Asish Kumar Solutions for Chapter: Data Handling, Exercise 3: Exercise
Attempt the free practice questions on Chapter 16: Data Handling, Exercise 3: Exercise with hints and solutions to strengthen your understanding. Connect With Mathematics 6 solutions are prepared by Experienced Embibe Experts.
Questions from Asish Kumar Solutions for Chapter: Data Handling, Exercise 3: Exercise with Hints & Solutions
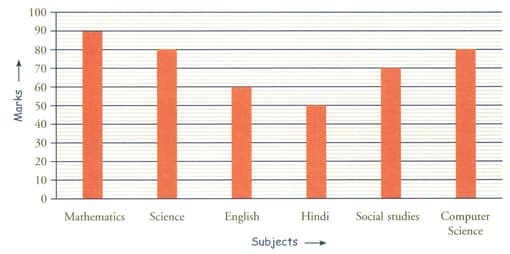
The bar graph shows the marks scored by Ravi during pre-test examination. Read the graph and answer the following questions.
In which two subjects Ravi got equal marks?
A factory produces cycles in the first week, in the second week, in the third week and in the fourth week.
Represent the information in the form of bar graph.
Use suitable scale and answer the following questions.
What is the production of cycle in a month?
A factory produces cycles in the first week, in the second week, in the third week and in the fourth week.
Represent the information in the form of a bar graph.
Use a suitable scale and answer the following questions.
In which week the production is maximum?
A factory produces cycles in the first week, in the second week, in the third week and in the fourth week.
Represent the information in the form of a bar graph.
Use a suitable scale and answer the following questions.
What is the difference of cycles produced during week and fourth week?
In a cricket match, each team gets overs to bat. The scoring pattern of the runs in the overs are given below.
| over runs | over runs |
| over runs | over runs |
| over runs | over runs |
| over runs | over runs |
| over runs | over runs |
| over runs | over runs |
| over runs | over runs |
| over runs | over runs |
| over runs | over runs |
| over runs | over runs |
Draw a bar graph. Answer the following questions.
What is the total score in a over match?
In a cricket match, each team gets overs to bat. The scoring pattern of the runs in the overs are given below.
| over runs | over runs |
| over runs | over runs |
| over runs | over runs |
| over runs | over runs |
| over runs | over runs |
| over runs | over runs |
| over runs | over runs |
| over runs | over runs |
| over runs | over runs |
| over runs | over runs |
Draw a bar graph. Answer the following questions.
In which over/s, the runs scored are same?
In a cricket match, each team gets overs to bat. The scoring pattern of the runs in the overs are given below.
| over runs | over runs |
| over runs | over runs |
| over runs | over runs |
| over runs | over runs |
| over runs | over runs |
| over runs | over runs |
| over runs | over runs |
| over runs | over runs |
| over runs | over runs |
| over runs | over runs |
Draw a bar graph. Answer the following questions.
In which over/s, the runs scored are maximum?
In a cricket match, each team gets overs to bat. The scoring pattern of the runs in the overs are given below.
| over runs | over runs |
| over runs | over runs |
| over runs | over runs |
| over runs | over runs |
| over runs | over runs |
| over runs | over runs |
| over runs | over runs |
| over runs | over runs |
| over runs | over runs |
| over runs | over runs |
Draw a bar graph. Answer the following questions.
In which over/s, the runs scored are minimum?


