
Exercise
Subject Experts Mathematics Solutions for Exercise
Simple step-by-step solutions to Exercise questions of Data Handling from Foundation Course Mathematics. Also get 3D topic explainers, cheat sheets, and unlimited doubts solving on EMBIBE.
Questions from Exercise with Hints & Solutions
Match the following.
| List-I | List-II | ||
| (P) | If  represents three flowers, then represents flowers. represents three flowers, then represents flowers. |
. | |
| (Q) |  represents stars, then represents _____ stars. represents stars, then represents _____ stars. |
. | |
| (R) |  represents trees, then represents ____ trees. represents trees, then represents ____ trees. |
. | |
| (S) |  represents girls, then represents _____ girls. represents girls, then represents _____ girls. |
. | |
Study the bar graph and match the lists.
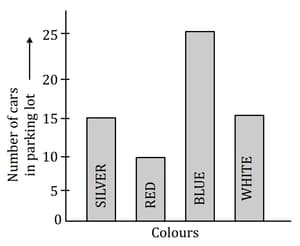
| List-I | List-II | ||
| (P) | Total number of cars in the parking lot is | Blue | |
| (Q) | Number of cars which are blue in colour is | ||
| (R) | The least common colour among the car is | ||
| (s) | The most common colour among the car is | Red | |
The birth rate per thousand for five countries over a period of time shown below.
| Country | China | India | Germany | U.K. | Sweden |
| Birth rate per thousand |
Represents the above data by a bar graph.
The heights (in cm) of boys of Class are:
Which height has the maximum frequency and minimum frequency in the given data?
The given bar graph shows the marks obtained by students in a Science test.

Who scored the highest marks in the test? What is the score.
Given below data is the marks in maths test of children of Class VI out of .
Arrange the data in decreasing order in frequency table using tally marks.
The following tables shows the marks obtained by Sumit in the annual examination.
| English | Maths | Hindi | Sanskrit | Science | Social studies |
Draw a bar graph to show the above information.
Draw a bar graph to represent the following data.
| Colour of T-shirt | Red | Blue | Orange | Pink | Green |
| Number of boys |


