
B Nirmala Shastry Solutions for Exercise 2: MISCELLANEOUS EXERCISE
B Nirmala Shastry Mathematics Solutions for Exercise - B Nirmala Shastry Solutions for Exercise 2: MISCELLANEOUS EXERCISE
Attempt the practice questions from Exercise 2: MISCELLANEOUS EXERCISE with hints and solutions to strengthen your understanding. ICSE MATHEMATICS CLASS 9 solutions are prepared by Experienced Embibe Experts.
Questions from B Nirmala Shastry Solutions for Exercise 2: MISCELLANEOUS EXERCISE with Hints & Solutions
The following table shows the number of students playing different games in a school.
| Game | Hockey | Cricket | Football | Basketball | Volleyball |
| Number of students |
Represent the above in a bar graph.
Draw a frequency polygon for the following
| Daily wages | |||||
| Number of workers |
The table given below shows the daily wages of labourers in a factory.
| Wages | ||||||
| Number of Labourers |
Draw frequency poly to represent the above data
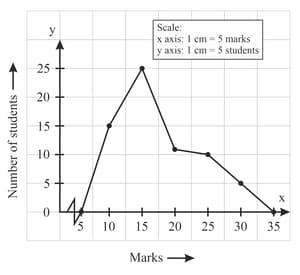
The frequency polygon below represents the marks obtained by some candidates in a test.Using the data in the diagram, prepare a frequency distribution table.
For the set of numbers, find the mean and median . Which measure describes the set of numbers?
The following table shows the height of athletes in a team.Draw a frequency polygon of the given data.
| Height (in cm) | ||||||
| Number of athletes |


