S K Gupta and Anubhuti Gangal Solutions for Chapter: Graphical Representation of Data, Exercise 2: Exercise 24(B)
S K Gupta Mathematics Solutions for Exercise - S K Gupta and Anubhuti Gangal Solutions for Chapter: Graphical Representation of Data, Exercise 2: Exercise 24(B)
Attempt the practice questions on Chapter 24: Graphical Representation of Data, Exercise 2: Exercise 24(B) with hints and solutions to strengthen your understanding. ICSE NUMBERS WIZ solutions are prepared by Experienced Embibe Experts.
Questions from S K Gupta and Anubhuti Gangal Solutions for Chapter: Graphical Representation of Data, Exercise 2: Exercise 24(B) with Hints & Solutions
Draw histogram for the following frequency distribution
| Size | ||||||
| Frequency |
Draw a histogram for the following frequency distribution
| Size | |||||
| Frequency |
Draw a histogram for the following frequency distribution
| Size | |||||
| Frequency |
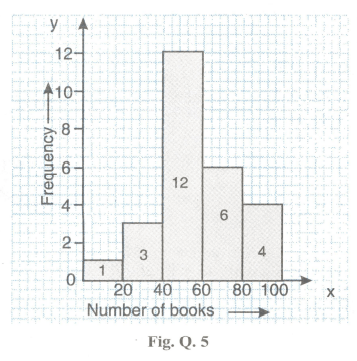
Complete: In the histogram below, people were surveyed, and of them _____ own between and books.
Complete: In the histogram shown below _____ students received grades between and , and students in all took the test.
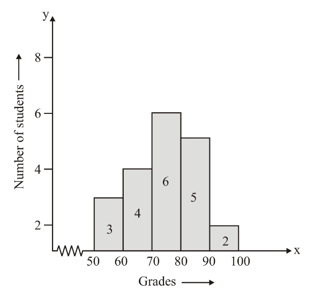
For the histogram shown alongside.
What is the total number of students over whom our study has been conducted?
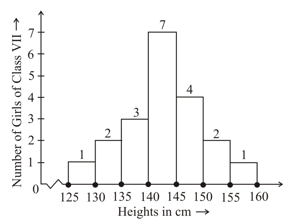
For the histogram given alongside answer the questions that follow.
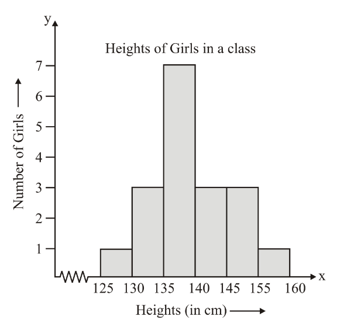
What is the total number of girls in the class?
For the histogram given alongside answer the question that follow.
How many girls have a height of or more?