
Mahabir Singh Solutions for Chapter: Data Handling, Exercise 2: ACHIEVERS SECTION (HOTS)
Mahabir Singh Mathematics Solutions for Exercise - Mahabir Singh Solutions for Chapter: Data Handling, Exercise 2: ACHIEVERS SECTION (HOTS)
Attempt the free practice questions on Chapter 9: Data Handling, Exercise 2: ACHIEVERS SECTION (HOTS) with hints and solutions to strengthen your understanding. IMO Olympiad Work Book 6 solutions are prepared by Experienced Embibe Experts.
Questions from Mahabir Singh Solutions for Chapter: Data Handling, Exercise 2: ACHIEVERS SECTION (HOTS) with Hints & Solutions
The line graph shows the number of teddy bears Latika sold from January to April.
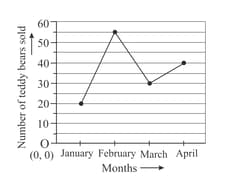
If she earned ₹ for every teddy bear sold, then how much more did she earn in April than in Mach?
Study the bar graph and state whether the given statements is true or false.
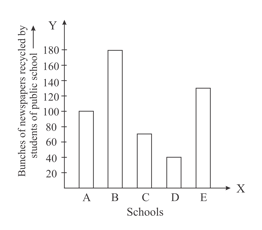
(). recycled more newspapers than .
(). recycled bunches of newspapers more than .
(). Five hundred bunches of newspaper were recycled in all.
(). The ascending order of the newspapers recycled by school is .
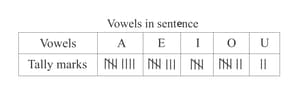
Jenny made the frequency table to show the number of times each vowel was used in the first sentence of several books she had red. Which of the following lists shows the vowels in order of the most used to the least used?
Study the pictograph and find the value of
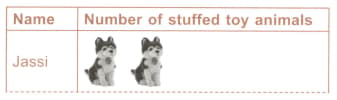
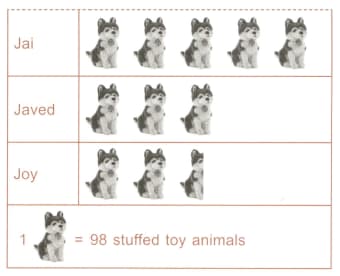
(i) The number of stuffed toy animals Jasssi and joy both have is .
(ii) Javed has more stuffed toy animals than jassi.
(iii) The total number of stuffed toy animals owned by all the students is .
(iv) The number of stuffed by animals joy has less than Javed is .
The given line graph shows the number of cars and motorcycles sold at Beena’s electronic store from September to December.
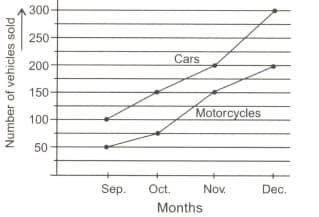
How many more cars than motorcycles did the store sell in October?


