
Goa Board Solutions for Chapter: Data Handling, Exercise 4: EXERCISE
Goa Board Mathematics Solutions for Exercise - Goa Board Solutions for Chapter: Data Handling, Exercise 4: EXERCISE
Attempt the practice questions on Chapter 5: Data Handling, Exercise 4: EXERCISE with hints and solutions to strengthen your understanding. MATHEMATICS Textbook for Class VIII solutions are prepared by Experienced Embibe Experts.
Questions from Goa Board Solutions for Chapter: Data Handling, Exercise 4: EXERCISE with Hints & Solutions
Can we use the histogram to show the following data? Give reason.
The height of competitors in athletics meet.
Can we use the histogram to show the following data? Give reason.
The number of cassettes produced by companies.
Can we use the histogram to show the following data? Give reason.
The number of passengers boarding trains from to at a station.
Draw a histogram using the frequency table of the following data and answer the following question.
The weekly wages (in ) of workers in a factory are.
How many workers earn and more?
Draw a histogram for the following data and answer the following question.
The weekly wages (in ) of workers in a factory are.
How many workers earn less than ?
The number of hours for which students of a particular class watched television during holidays is shown through the given graph.
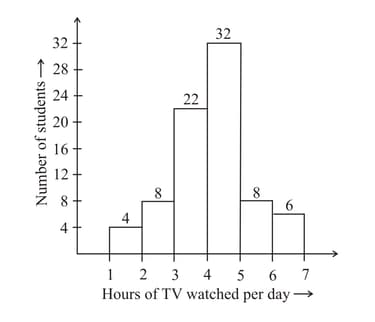
If the maximum number of students watch the TV for , then find the value of
The number of hours for which students of a particular class watched television during holidays is shown through the given graph.

How many students watched TV for less than hours?
The number of hours for which students of a particular class watched television during holidays is shown through the given graph.

How many students spent more than hours in watching TV?


