
Vinay Sharma and H K Thakur Solutions for Chapter: Data Handling, Exercise 2: SELF PRACTICE 9.2
Vinay Sharma Mathematics Solutions for Exercise - Vinay Sharma and H K Thakur Solutions for Chapter: Data Handling, Exercise 2: SELF PRACTICE 9.2
Attempt the free practice questions on Chapter 9: Data Handling, Exercise 2: SELF PRACTICE 9.2 with hints and solutions to strengthen your understanding. MBD Super Refresher Mathematics 6 solutions are prepared by Experienced Embibe Experts.
Questions from Vinay Sharma and H K Thakur Solutions for Chapter: Data Handling, Exercise 2: SELF PRACTICE 9.2 with Hints & Solutions
The total number of cows in five villages are as follows:
| Villages: | |||||
| Number of cows present in each village: |
Prepare a pictograph of these animals using one symbol to represent animals and answer the following questions from the pictograph:
How many symbols represent cows of Village and Village ?
The total number of cows in five villages are as follows:
Village
Village
Village
Village
Village
Prepare a pictograph of these animals using one symbol to represent animals and answer the following question from the pictograph:
What is the total number of cows in all the five villages ? (Write the numeral value.)
The total number of cows in five villages are as follows:
| Villages: | |||||
| Number of cows present in each village: |
How many more cows are there in Village than in Village ?
The total number of cows in five villages are as follows:
| Villages: | |||||
| Number of cows present in each village: |
Prepare a pictograph of these animals using one symbol to represent animals and answer the following questions from the pictograph.
Name the village which has the least number of cow. (Write village number)
The total number of cows in five villages are as follows:
| Villages: | |||||
| Number of cows present in each village: |
If the maximum number of cows is in Village , then find the value of .
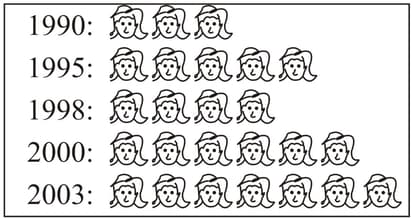
The total number of children of a school in different years is shown in the following pictograph where one  represents children.

In which year the number of children was least?
The total number of children of a school in different years is shown in the following pictograph where one  represents 100 children.
What was the number of children in 1998?
The total number of children of a school in different years is shown in the following pictograph where one  represents children.
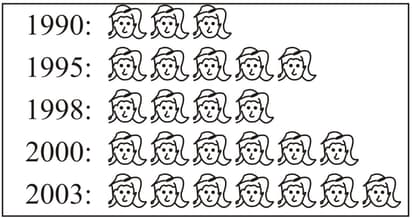
How many more children were there in the school in than in ?


