
Andrew Allott Solutions for Chapter: Reproduction, Exercise 14: Summative assessment
Andrew Allott Life Sciences Solutions for Exercise - Andrew Allott Solutions for Chapter: Reproduction, Exercise 14: Summative assessment
Attempt the practice questions on Chapter 4: Reproduction, Exercise 14: Summative assessment with hints and solutions to strengthen your understanding. MYP Life Sciences A concept based approach Years 1-3 solutions are prepared by Experienced Embibe Experts.
Questions from Andrew Allott Solutions for Chapter: Reproduction, Exercise 14: Summative assessment with Hints & Solutions
The human population has been rising rapidly and there are concerns that now it is so high that damage to natural ecosystem is unavoidable. Further, increases in human population are inevitable unless fertility rates fall. This has already happened in most developed countries. China introduced a compulsory one child policy in 1978 – 80 to reduce fertility rates. The policy has now ended. Taiwan never introduced such a policy. The graph shows total fertility rate (average number of children born to each woman during her whole life), in China and Taiwan from 1945 to 2015.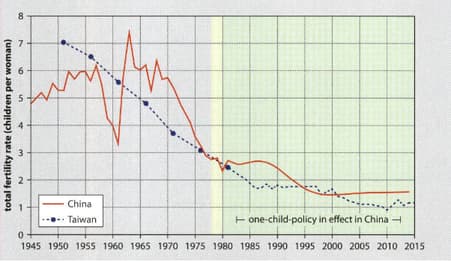
Prosperity rose in China increasingly rapidly from 1980 onwards. Some people claim that total fertility rate drops as prosperity rises, so women in China would have had fewer children even without a compulsory one child policy. Use the data in the graph to discuss this claim.
Scientists can influence what conclusions people draw from data by the format that they use to display it. Each point on the following graph shows the change in fertility rate and the cost of housing in one county in the US between 2010 and 2016.

What change happened to fertility in most counties between 2010 and 2016.
Scientists can influence what conclusions people draw from data by the format that they use to display it. Each point on the following graph shows the change in fertility rate and the cost of housing in one county in the US between 2010 and 2016.

What line of best fit on the graph would show the trend in the data?
Scientists can influence what conclusions people draw from data by the format that they use to display it. Each point on the following graph shows the change in fertility rate and the cost of housing in one county in the US between 2010 and 2016.

What conclusion do you draw from this graph?
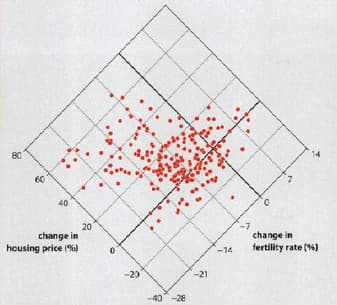
Evolutionary biologist Carl Bergstrom and information scientists Jevin West have suggested a new way of presenting data - a diamond plot. The following graph shows the same data as the previous graph, but in a diamond plot.

What line of best fit on diamond plot would show trend in the data?
Evolutionary biologist Carl Bergstrom and information scientists Jevin West have suggested a new way of presenting data - a diamond plot. The following graph shows the same data as the previous graph, but in a diamond plot.

What conclusion is most likely to be drawn from the diamond plot?
Evolutionary biologist Carl Bergstrom and information scientists Jevin West have suggested a new way of presenting data - a diamond plot. The following graph shows the same data as the previous graph, but in a diamond plot.

Does the data in the diamond plot support the claim that women choose to have fewer children when their living standards rise? Explain your answer fully.
Evolutionary biologist Carl Bergstrom and information scientists Jevin West have suggested a new way of presenting data - a diamond plot. The following graph shows the same data as the previous graph, but in a diamond plot.
Discuss the factors that might influence a woman's personal choice about how many children to have.


