
David Weber, Talei Kunkel, Harriet Simand and, Justin Medved Solutions for Chapter: Data Management Trends in Communities, Exercise 30: Unit review
David Weber Mathematics Solutions for Exercise - David Weber, Talei Kunkel, Harriet Simand and, Justin Medved Solutions for Chapter: Data Management Trends in Communities, Exercise 30: Unit review
Attempt the practice questions on Chapter 6: Data Management Trends in Communities, Exercise 30: Unit review with hints and solutions to strengthen your understanding. MYP Mathematics A concept-based approach 1 solutions are prepared by Experienced Embibe Experts.
Questions from David Weber, Talei Kunkel, Harriet Simand and, Justin Medved Solutions for Chapter: Data Management Trends in Communities, Exercise 30: Unit review with Hints & Solutions
| Number of texts sent per day | Percentage of teen responses | Percentage of adult responses |
| or more |
Draw a graph for how you think the same age groups would have responded ten years ago. Explain your graph.
| Number of texts sent per day | Percentage of teen responses | Percentage of adult responses |
| or more |
Draw a graph for how you think the same groups will respond ten years from now. Explain your graph
A study collected data on media usage and other elements of life for a group of to year old. The data is represented in table below.
| I am a heavy user of media | I am a moderate user of media | I am a light user of media | |
| I get good grades | |||
| I get fair/ poor grades | |||
| I have a lot of friends | |||
| I get into trouble a lot |
Based on the table , describe characteristics of heavy users of media compared to light users . Does anything surprise you about the data?
The following data is for the five largest African countries by population
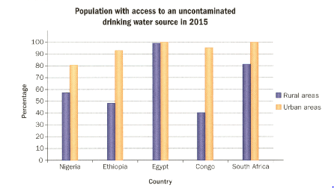
What is the difference between a rural and an urban area?
The following data is for the five largest African countries by population

Which country has the lowest percentage of access to safe drinking water in urban area?
The following data is for the five largest African countries by population

Which country has the lowest percentage of access to safe drinking water in urban areas?
The following data is for the five largest African countries by population

Overall , which country has the most access to safe drinking water?
The following data is for the five largest African countries by population
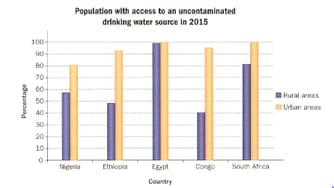
Represent this data using multiple pie chat. Which representation is more effective?


