
Jharne De and Ranjana Kumar Solutions for Chapter: Introduction to Graphs, Exercise 2: Multiple-Choice Questions
Jharne De Mathematics Solutions for Exercise - Jharne De and Ranjana Kumar Solutions for Chapter: Introduction to Graphs, Exercise 2: Multiple-Choice Questions
Attempt the practice questions on Chapter 16: Introduction to Graphs, Exercise 2: Multiple-Choice Questions with hints and solutions to strengthen your understanding. Math Sight book solutions are prepared by Experienced Embibe Experts.
Questions from Jharne De and Ranjana Kumar Solutions for Chapter: Introduction to Graphs, Exercise 2: Multiple-Choice Questions with Hints & Solutions
Anuj is driving a bike at a constant speed of . Draw a distance-time graph, and also find the time taken by him to cover a distance of .
The radius of a circle varies with first five prime numbers. Make a table for the diameters of circle and plot them as a linear graph.
Draw a line graph depicting the sales of a salesman during weekdays:
| Days (x) | Monday | Tuesday | Wednesday | Thursday | Friday | Saturday |
| Sales (y) |
Plot the points on the graph paper and join B to C. Find the area of the figure so obtained.
The following graph shows the temperature of a solution recorded over a period of time.
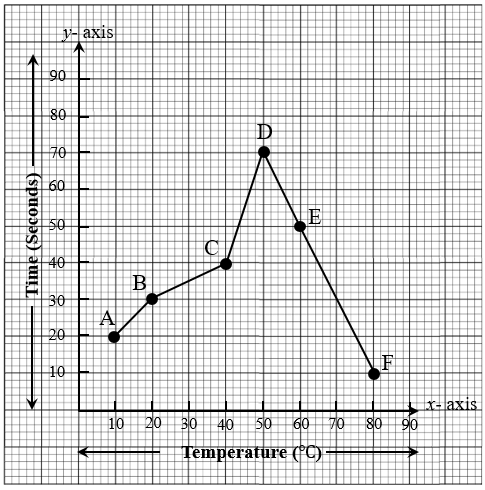
Which point depicts the maximum temperature?
The following graph shows the temperature of a solution recorded over a period of time.
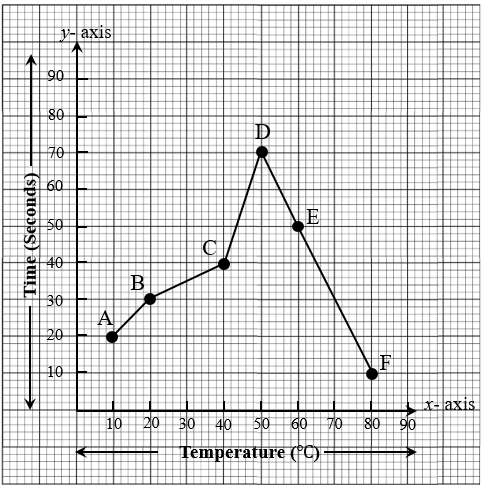
What is the difference in temperatures at the end of and ?
The following graph shows the number of passengers travelling in a metro during different hours of a day.
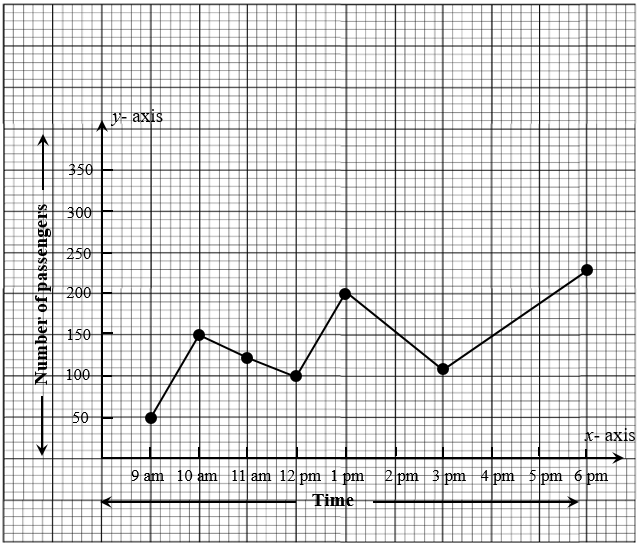
At what time was the crowd the maximum?
The following graph shows the number of passengers travelling in a metro during different hours of a day.
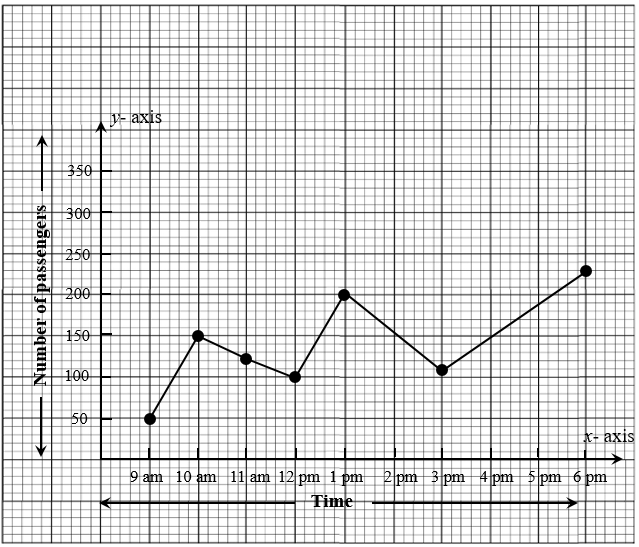
How many passengers travelled between and


