
Jharne De and Ranjana Kumar Solutions for Chapter: Introduction to Graphs, Exercise 6: Test Paper 2
Jharne De Mathematics Solutions for Exercise - Jharne De and Ranjana Kumar Solutions for Chapter: Introduction to Graphs, Exercise 6: Test Paper 2
Attempt the free practice questions on Chapter 16: Introduction to Graphs, Exercise 6: Test Paper 2 with hints and solutions to strengthen your understanding. Math Sight book solutions are prepared by Experienced Embibe Experts.
Questions from Jharne De and Ranjana Kumar Solutions for Chapter: Introduction to Graphs, Exercise 6: Test Paper 2 with Hints & Solutions
A point lies in quadrant. What will be the coordinates of its mirror image in the quadrant.
Plot the points on the graph. Do you get a straight line?
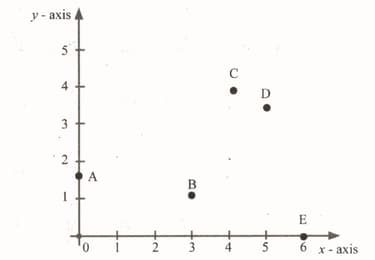
Find the coordinates of the following points:
Draw a linear graph for the following data:
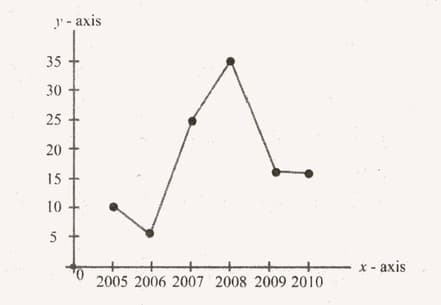
The following graph shows the yearly sales of a company. Find the sales during the years
If the cost and quantity of a commodity varies directly, then find the missing entries and also plot the graph.
| Quantity | _____ | |||
| Cost | _____ | _____ |
The runs scored by a cricket team during first five overs is as follows:
| Overs | |||||
| Runs |
Plot the graph and find the run rate during the fifth over.
The following table shows the rainfall recorded for the same duration in two cities:
| Week | Week | Week | Week | Week | |
| City | |||||
| City |
Plot the graph. Find the average rainfall for both the cities.


