Jharne De and Ranjana Kumar Solutions for Chapter: Data Handling, Exercise 3: work it Out
Jharne De Mathematics Solutions for Exercise - Jharne De and Ranjana Kumar Solutions for Chapter: Data Handling, Exercise 3: work it Out
Attempt the free practice questions on Chapter 16: Data Handling, Exercise 3: work it Out with hints and solutions to strengthen your understanding. Math Sight solutions are prepared by Experienced Embibe Experts.
Questions from Jharne De and Ranjana Kumar Solutions for Chapter: Data Handling, Exercise 3: work it Out with Hints & Solutions
The data given below indicates the number of televisions sold by a shop from January to June in a particular year. Draw the bar graph and answer the question:
| Month | No. of TVs sold |
| January | 80 |
| February | 90 |
| March | 100 |
| April | 80 |
| May | 70 |
| June | 60 |
Robin goes to a fair and plays a game there. There are three inverted buckets. A ball is hidden under one of them. Robin has to choose the bucket with the hidden ball. Fill in the blank.
Robin's chances of choosing the correct bucket are_____ .
Robin goes to a fair and plays a game there. There are seven inverted buckets. A ball is hidden under one of them. Robin has to choose the bucket with the hidden ball. If the chance is , then would be _____.
Robin goes to a fair and plays a game there. There are three inverted buckets. A ball is hidden under one of them. Robin has to choose the bucket with the hidden ball. Fill in the blank.
If there were buckets, the chance would be_____ .
Robin goes to a fair and plays a game there. There are three inverted buckets. A ball is hidden under one of them. Robin has to choose the bucket with the hidden ball. If there were buckets, the chance would be . Then, _____.
Find the median of the following data:
If is added to the above list, find the new median.
If the mode of the following data is , find the value of :
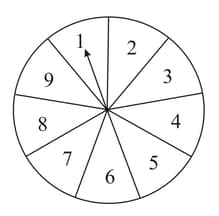
The spinning wheel shown below has numbers from to , and the best prize is on number. Find the probability of getting the best prize.