
Jharne De and Ranjana Kumar Solutions for Chapter: Data Handling, Exercise 1: Exercise
Jharne De Mathematics Solutions for Exercise - Jharne De and Ranjana Kumar Solutions for Chapter: Data Handling, Exercise 1: Exercise
Attempt the practice questions on Chapter 17: Data Handling, Exercise 1: Exercise with hints and solutions to strengthen your understanding. Math Sight solutions are prepared by Experienced Embibe Experts.
Questions from Jharne De and Ranjana Kumar Solutions for Chapter: Data Handling, Exercise 1: Exercise with Hints & Solutions
The following table shows the number of patients who visited of a city hospital during a particular week:
| Day | Monday | Tuesday | Wednesday | Thursday | Friday | Saturday |
| No. of patients |
Draw a bar graph to represents the above data and answer the following questions:
On which day did the maximum number of patients visit the hospital?
The following table shows the number of patients who visited of a city hospital during a particular week:
| Day | Monday | Tuesday | Wednesday | Thursday | Friday | Saturday |
| No. of patients |
Draw a bar graph to represents the above data and answer the following questions:
On which day did the minimum number of patients visit the hospital?
The following table shows the number of patients who visited of a city hospital during a particular week:
| Day | Monday | Tuesday | Wednesday | Thursday | Friday | Saturday |
| No. of patients |
Draw a bar graph to represents the above data and answer the following questions:
How many patients visited on Saturday?The bar graph shows the number of toys produced by a factory during a certain week.

Answer the following question;
On which day the maximum number of toys were produced?
The bar graph shows the number of toys produced by a factory during a certain week.

Answer the following question;
On which days equal number of toys were produced?The bar graph shows the number of toys produced by a factory during a certain week.
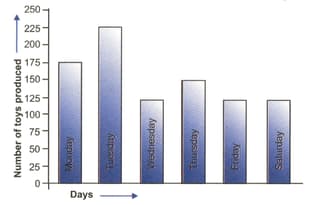
Answer the following question;
What is the total number of toys produced during the week?The bar graph shows the number of toys produced by a factory during a certain week.

Answer the following question;
On which day the minimum number of toys were produced?The birth rate per thousand in five countries over a period of time is given below:
| Country | China | India | Sweden | England | Germany |
| Birth rate |
Draw a bar graph to represent the above data.


